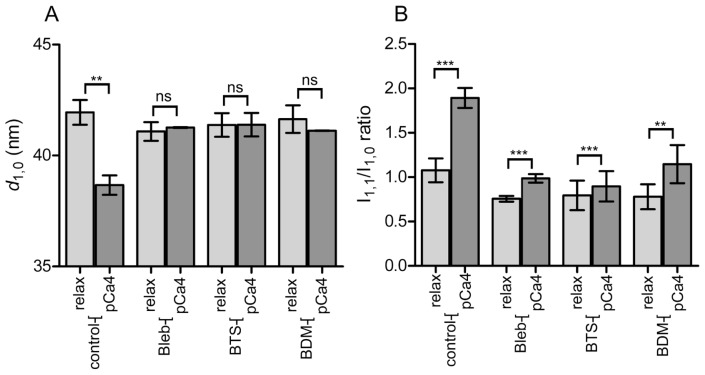
Figure 3.
Summary of analysis of X-ray equatorial reflections of skinned rabbit skeletal muscle fibers in the presence or absence of inhibitors. (A), The 1,0 lattice spacing (d1,0), obtained by Gaussian fitting of the reflection intensity profile after subtraction of the background (assumed exponential). (B), The 1,1/1,0 equatorial reflection intensity ratio from the same fibers. In both (A) and (B), the values are the mean±S.D. (n=6 sets of fibers for blebbistatin and n=4 for others). In most cases, 6 fibers were mounted in a single set, and this was sufficient for recording the equatorial reflections. The results of the paired t-test are also shown. ns=non-significant; and the levels of significance are; *, p<0.05; **, p<0.01; ***, p<0.001.

