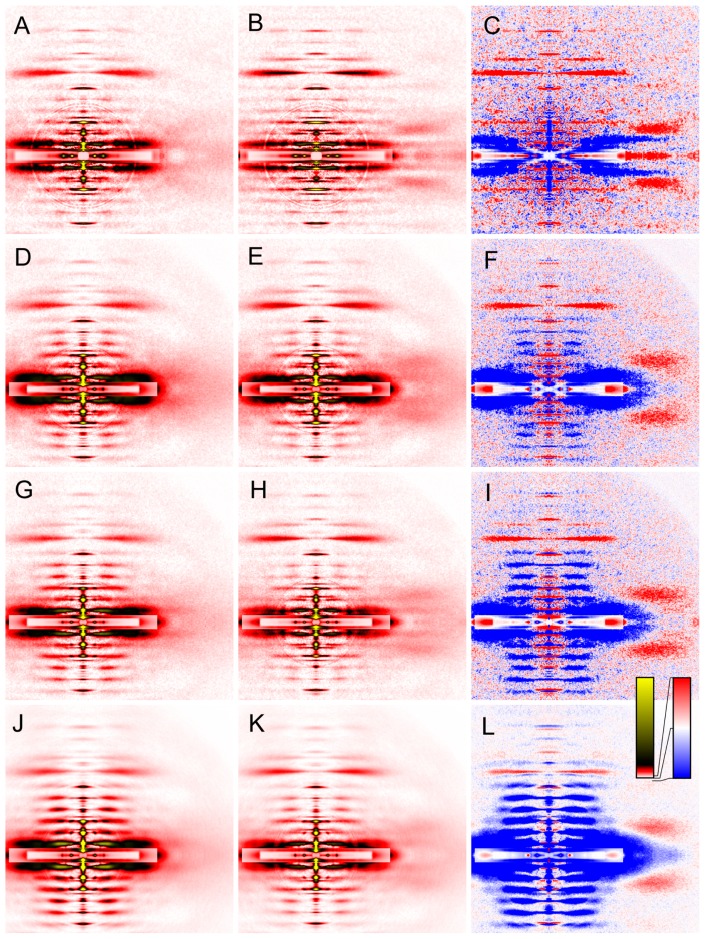
Figure 5.
Effect of calcium-activation on two-dimensional diffraction patterns from skinned rabbit psoas fibers in the presence or absence of inhibitors at 6–8°C. (A, B, C), control; (D, E, F), 100 μM BTS; (G, H, I), 50 mM BDM; (J, K, L), 100 μM blebbistatin. (A, D, G, J), relaxed; (B, E, H, K), calcium-activated; (C, F, I, L), difference between calcium-activated and relaxed patterns. The red color indicates that the intensities are increased upon calcium-activation. The blue area, decreased. The pattern in (K) is identical to the one in Figure 4. Patterns were summed for up to 4 sets of 30 muscle fibers.

