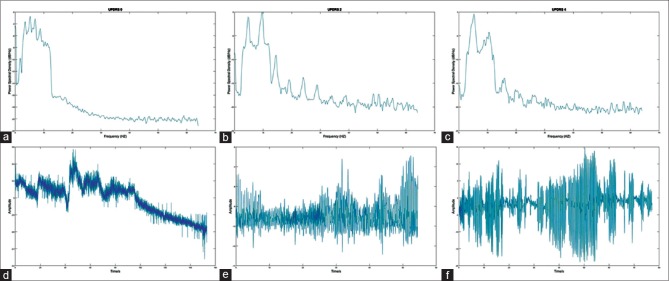
Figure 3.
Figure showing the power spectrum density spectrum where the horizontal axis shows the Frequency in Hz and the vertical axis shows the amplitude of power spectrum density, (a) belongs to patient with UPDRS0, (b) to UPDRS2, (c) to UPDRS4, (d-f) are raw signals of Parkinson patients in which (d) belongs to UPDRS0, (e) belongs to UPDRS2, and (f) to UPDRS4. UPDRS – Unified Parkinson's Disease Rating Scale

