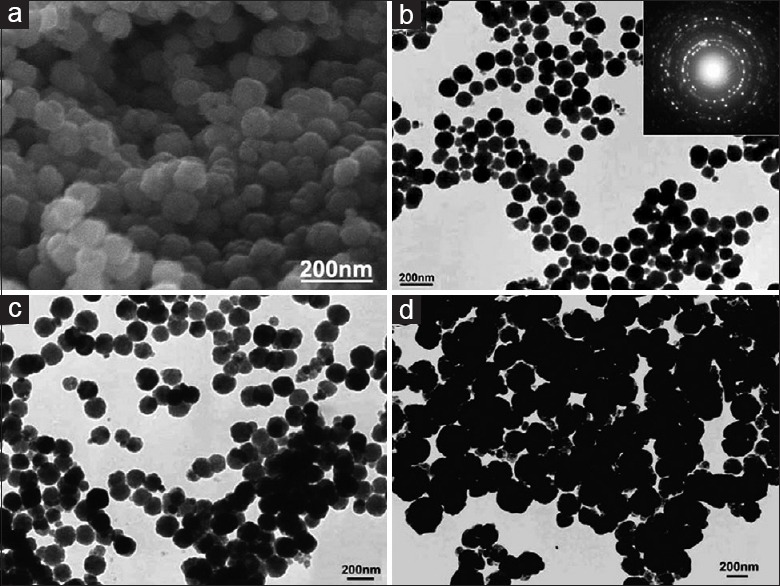
Figure 6.

The SEM (a) and TEM (b) images of Fe3O4 nanoparticles prepared with the mixture of SDS (4.0 mmol) and PEG (0.4 g, ∼7 mmol and TEM (c and d) images of Fe3O4 nanoparticles synthesized with different protective agents under typical reaction conditions. (c) 4.0 mmol of SDS. (d) 0.4 g (∼7.0 mmol of repeating units) of PEG. SEM – Scanning electron microscopy, TEM – Transmission electron microscope; PEG – Polyethylene glycol
