Figure 5.

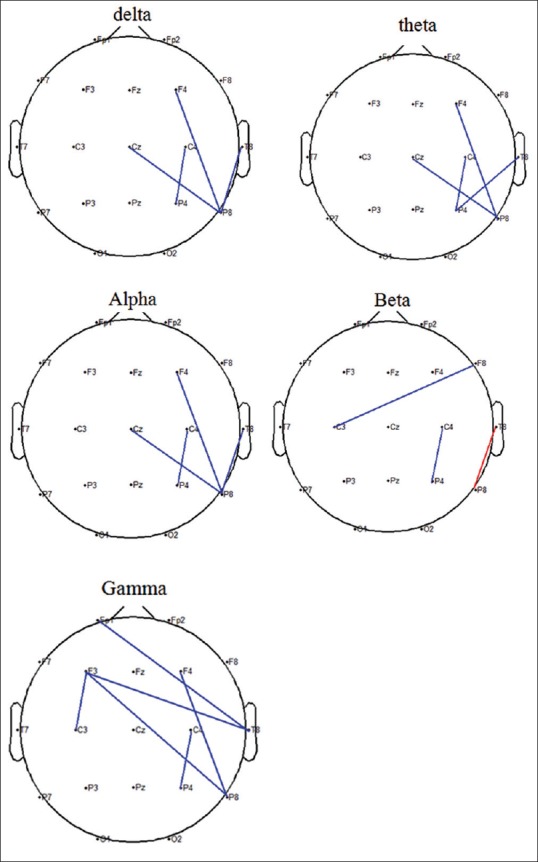
Spectral coherence graph between brain channels in pattern recognition memory in frequency bands. Blue color shows significant difference lower than 0.05 and red color shows significant difference lower than 0.01

Spectral coherence graph between brain channels in pattern recognition memory in frequency bands. Blue color shows significant difference lower than 0.05 and red color shows significant difference lower than 0.01