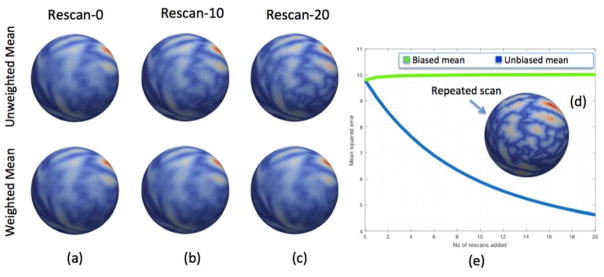
Figure 3.
Iterative rescan data example of sulcal depth feature from Kirby dataset. Row 1 is un-weighted mean and row 2 is weighted mean from (a) to (c) with each scenario containing (a) 21 subjects with no rescan data, (b) 21 subjects with 10 repeats of rescan from one of the subject, and (c) 21 subjects with 20 repeats of rescan from one of the subjects. The inlay (d) shows the sulcal depth of subject whose rescan is added iteratively. Plot (e) presents the mean squared distance to rescan subject from un-weighted mean (blue) and weighted mean (green).

