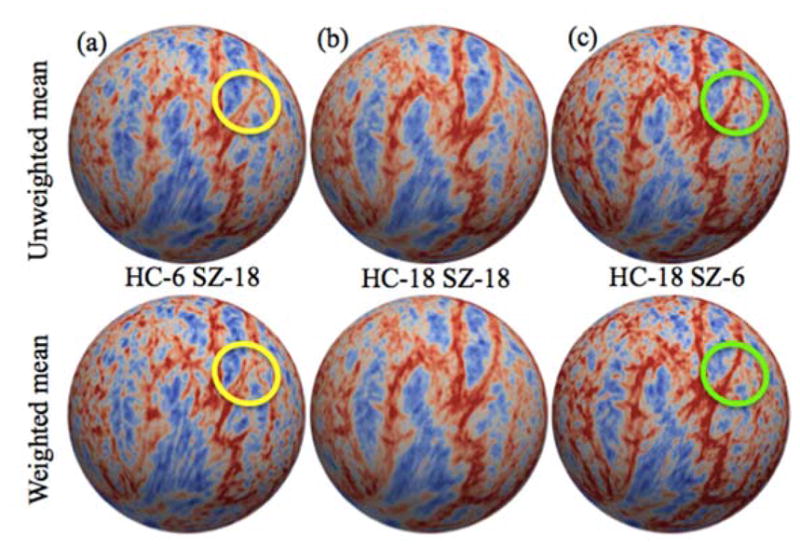
Figure 4.

Mean curvature qualitative plot of un-weighted mean and weighted mean with different number of subjects in control and schizophrenia populations. Feature data in each scenario included (a) 6 controls and 18 schizophrenic patients, (b) 18 controls and 18 schizophrenic patients, and (c) 18 controls and 6 schizophrenic patients. Both un-weighted and weighted mean are similar with equal number of subjects in each group. However, the un-weighted mean had higher variance across the sampling strategies. The ovals emphasize qualitative areas of difference.
