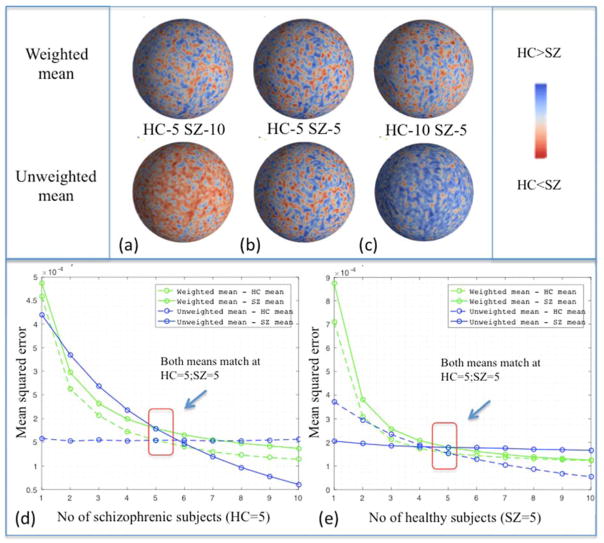
Figure 5.
Mean curvature quantitative plot with relative absolute distance of un-weighted mean and weighted mean between control and schizophrenic means. Data are normalized between −1 and 1 between patients with schizophrenia and controls. Feature data in each scenario from qualitative plot included (a) 5 controls and 10 patients with schizophrenia (b) 5 controls and 5 patients with schizophrenia, and (c) 10 controls and 5 patients with schizophrenia. The color bar on the side indicates how close the relative distance is with respect to control mean (blue) and schizophrenia mean (red). The top row is from weighted mean while the lower row is from the un-weighted mean. Mean square error of mean curvature values with respect to control and schizophrenic means with varying number of subjects in each group is shown below. In (d), the number of controls was fixed at 5 and the number of patients with schizophrenia varied from 1 to 10. In (e), the number of patients with schizophrenia was fixed at 5 and the number of control subjects varied from 1 to 10. When the number of subjects in each group is equal, then both the un-weighted and weighted means are equal as highlighted in red box.

