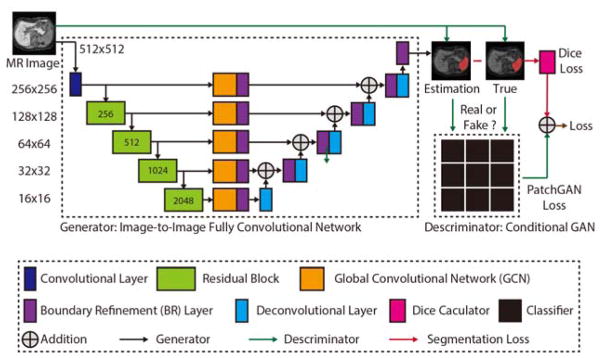
Figure 1.
The proposed network structure of the Splenomegaly Segmentation Net (SSNet). The number of channels of each encoder is shown in the green boxes, while the number of channels of each decoder is two. The image (or feature map) resolution for each level is shown on the left side of this figure.

