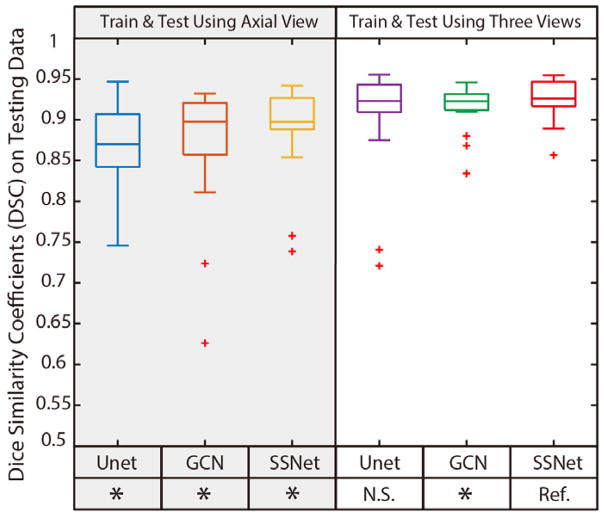
Figure 4.
The quantitative results of different methods. The box plots in left panel indicate the results of using only axial view images, while the right panel presents the results of using all axial, coronal and sagittal images as in both training and testing. The Wilcoxon signed rank tests were employed as statistical analyses, where “Ref.” indicates the reference method. The “*” indicates the p<0.01 while the “NS” means not significant.

