
Fig 2.
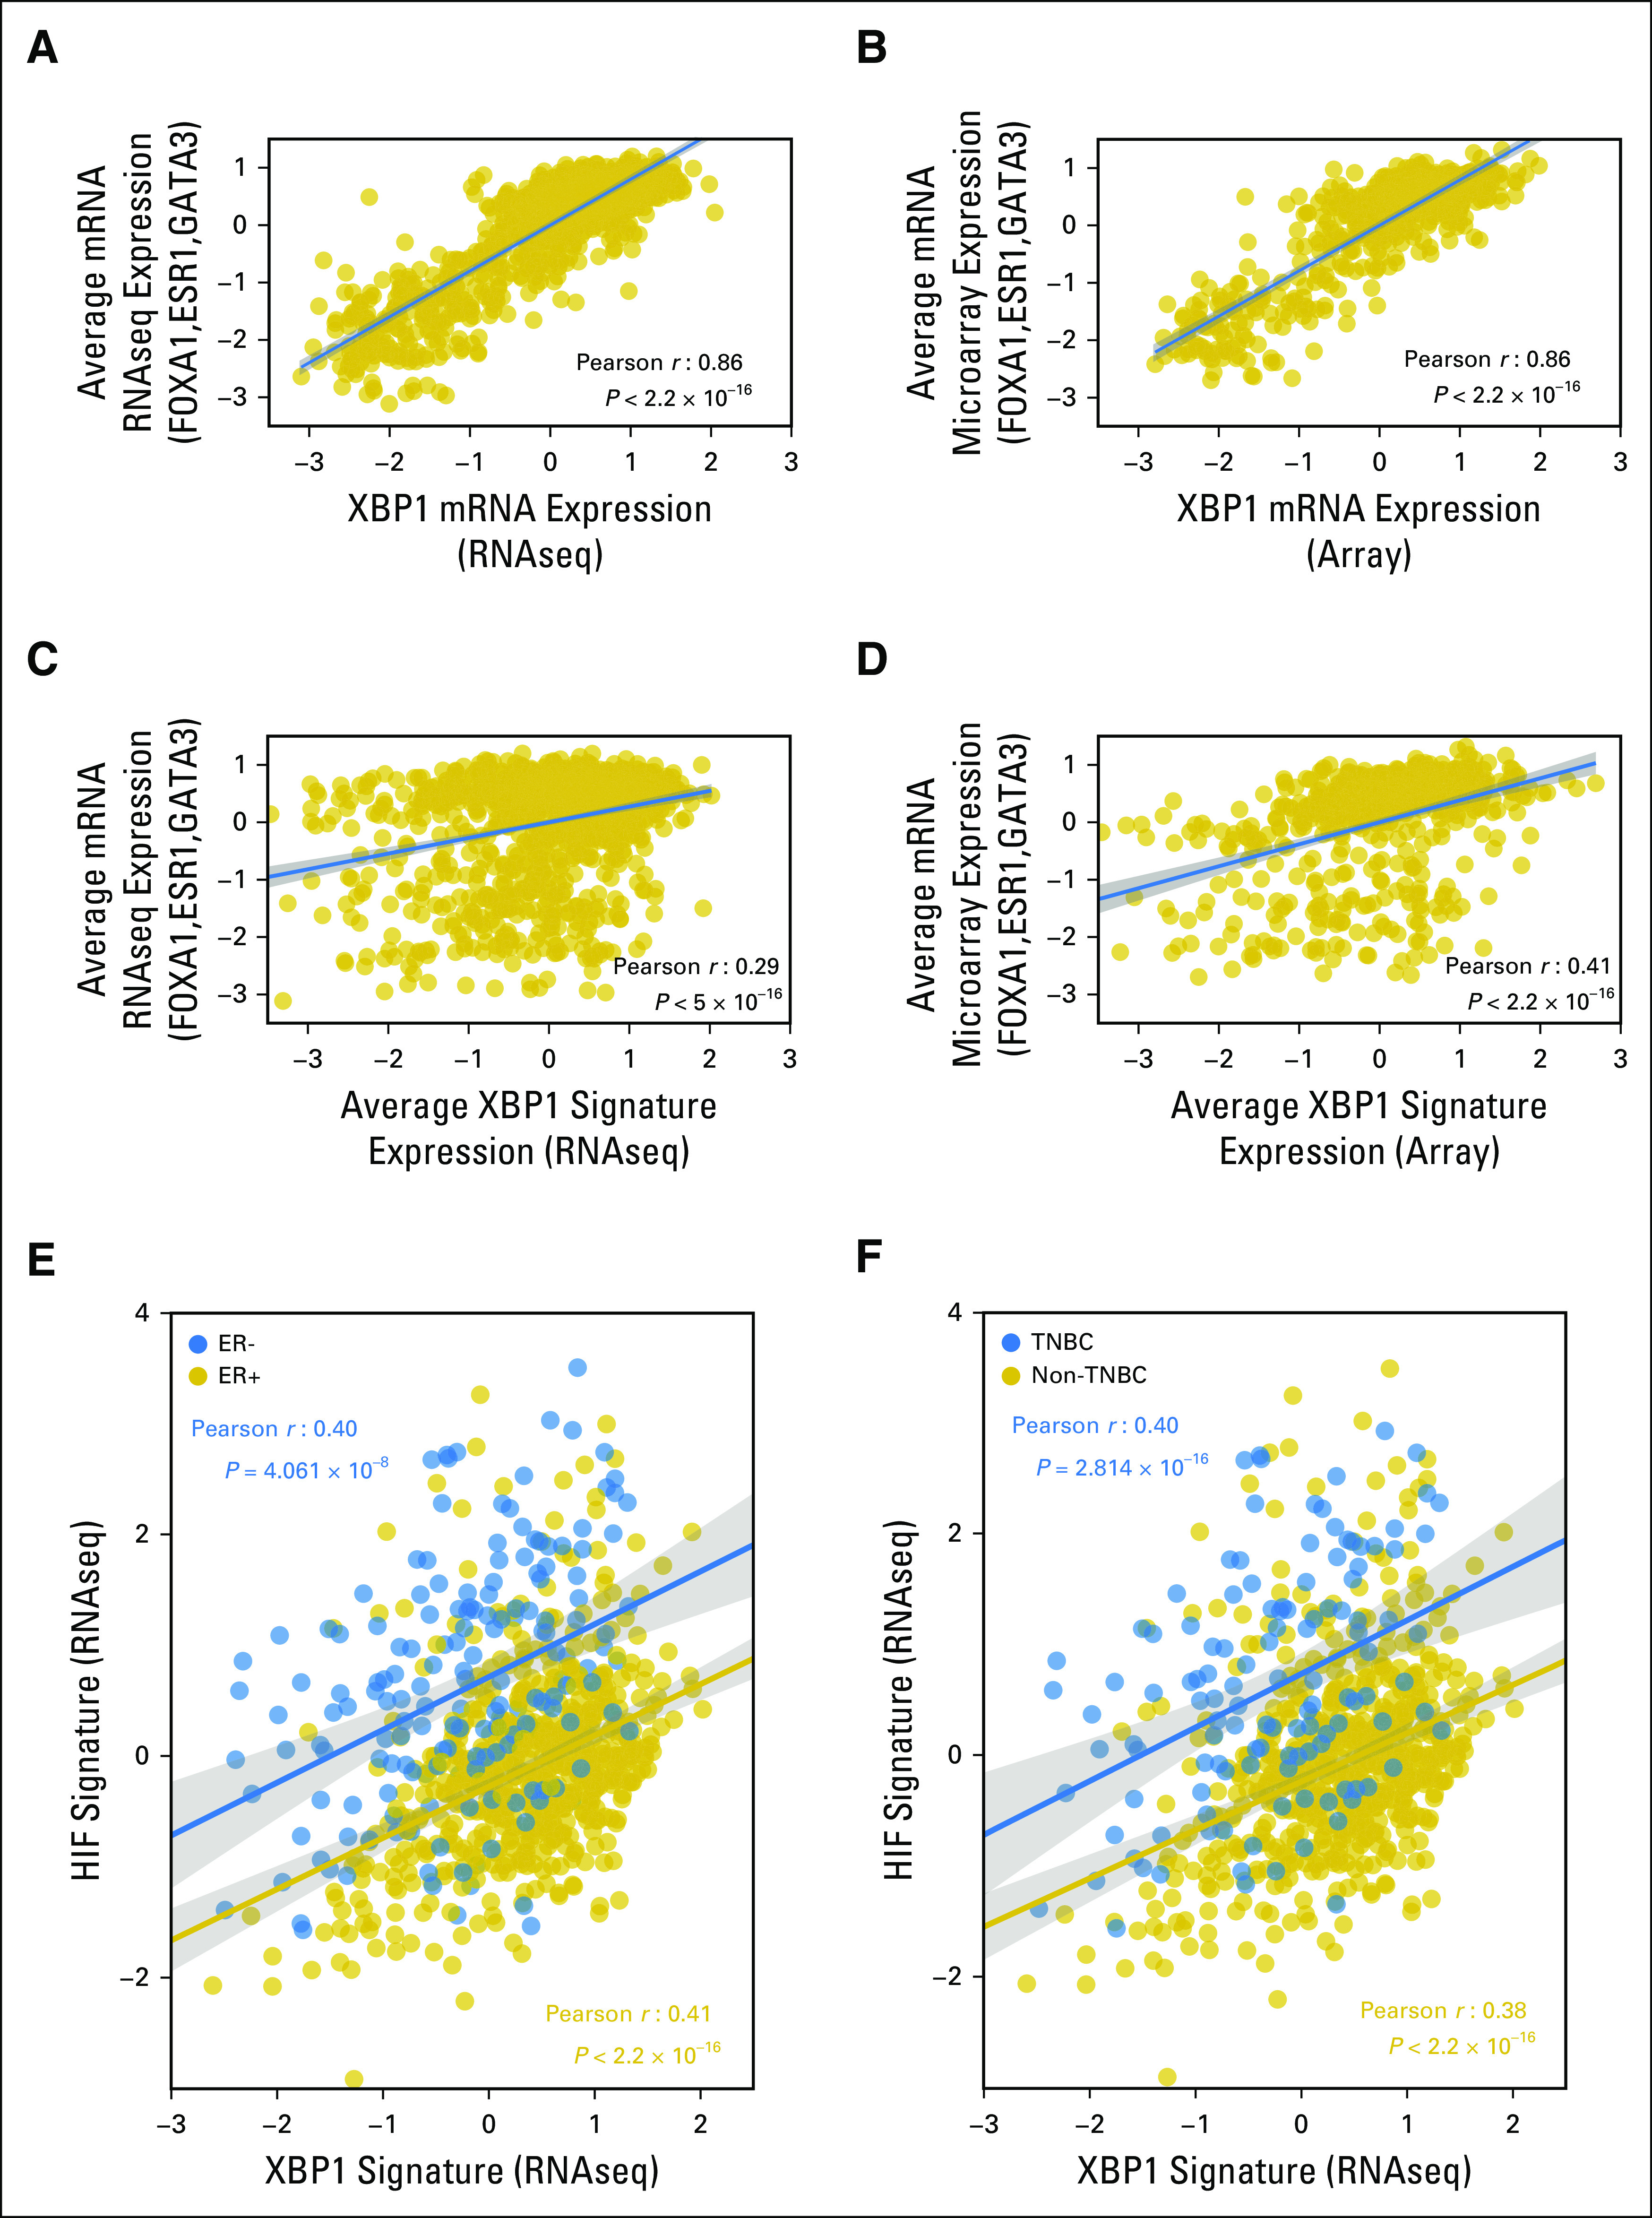
Correlation of XBP1 mRNA expression and the XBP1 gene signature with estrogen receptor (ER) pathway gene expression and correlation of the XBP1 and HIF1α gene signatures in the The Cancer Genome Atlas (TCGA) breast cancer data set. Correlation analysis of expression of the XBP1 gene and the average of three ER pathway genes (ESR1, FOXA1, and GATA3) using (A) RNAseq or (B) microarray data from 1,182 patients with breast cancer in TCGA breast cancer database and the same correlation analysis of the average expression of the XBP1 gene signature and the three ER pathway genes on the basis of (C) RNAseq or (D) microarray data in the TCGA database. (E, F) Correlation of the average expression of the XBP1 and HIF1α gene signatures in the groups of patients with breast cancer, on the basis of the RNAseq data in the TCGA database: (E) ER+ (n = 600 patients, gold) and ER− (n = 179 patients, blue); and (F) triple-negative breast cancer (TNBC; n = 125 patients, blue) and non-TNBC (n = 647 patients, gold). The Pearson coefficients of correlation as well as the P values are shown in (A-D) black or the (E, F) corresponding colors. The fitted lines and the 95% CIs (shades) are also shown. Only patients with known status for ER/progesterone receptor/HER2 defined experimentally were used for analysis.