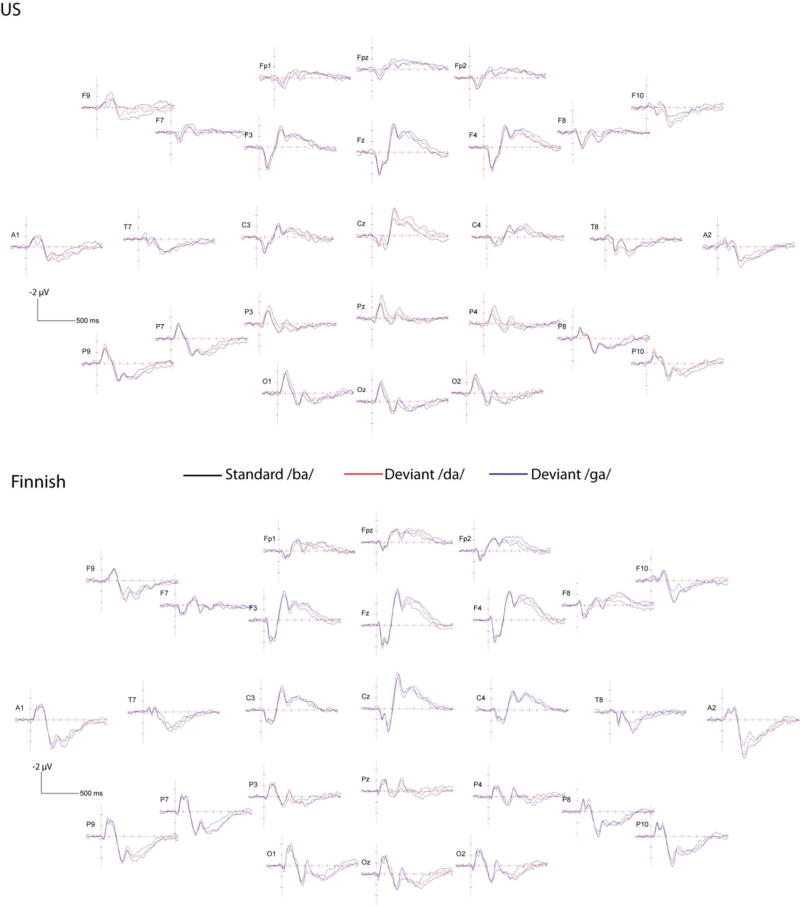
Figure 2.
ERP waveforms in response to the English stimuli in the US sample of children (above; N=54) and in the Finnish sample of children (below; N=38). Black line is the response to the standard /ba/ stimulus, blue line the deviant /da/ stimulus, and red line the deviant /ga/ stimulus. ERP montage has been transformed to the standard 10-10 electrode positions and re-referenced to the average reference. Horizontal line marks 100 ms and vertical line marks 1 µV, negative voltages are plotted up.

