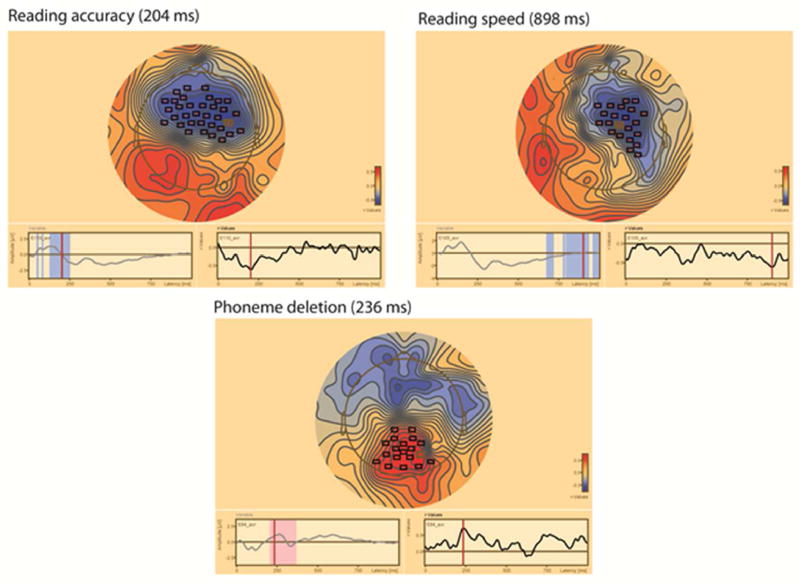
Figure 6.
Topographic distribution of the correlation coefficient values between the deviant /ga/ stimulus and cognitive measures in the Finnish sample (N=38). Channel clusters with statistically significant values are marked with boxes in the topography. In the topography plot, red color denotes positive coefficients and blue negative coefficients. Topography is plotted at the highest coefficient values (time point indicated in parenthesis after the cognitive measure). Left bottom: Time windows associated with the channel cluster are marked with red and blue on the ERP waveform from the channel with maximal correlation. Right bottom: correlation coefficients for each time point at the maximal channel.

