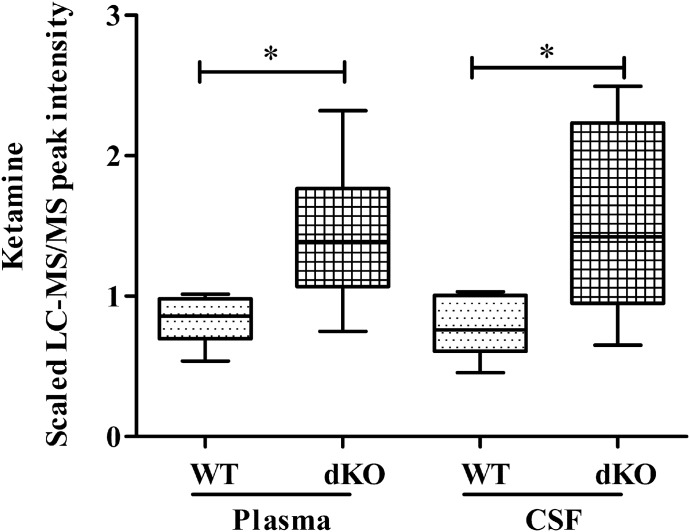
Fig. 1.
Elevated ketamine CSF and plasma levels in Pgp/Bcrp dKO versus WT rats. Ketamine levels in male Sprague-Dawley rats after intraperitoneal administration of 100 mg/kg ketamine. Data are plotted as the median LC-MS/MS peak intensity ± range (n = 8/genotype). The plasma and CSF median peak intensity in dKO rats was compared with the corresponding median peak intensity from WT rats using the unpaired t test with the Welch correction. *P < 0.05.

