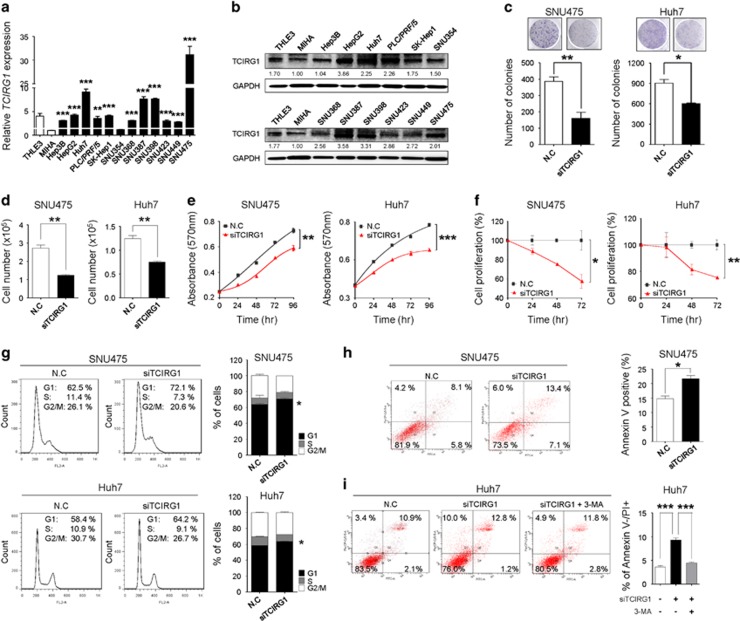
Figure 3.
TCIRG1 knockdown has anti-tumorigenic effects on hepatocellular carcinoma (HCC) cells. (a) qRT-PCR analysis of TCIRG1 in 14 hepatic cell lines, including two normal (THLE3 and MIHA) and 12 hepatoma cell lines (Hep3B, HepG2, Huh7, PLC/PRF/5, SK-Hep1, SNU354, SNU368, SNU387, SNU398, SNU423, SNU449 and SNU475). Glyceraldehyde-3-phosphate dehydrogenase (GAPDH) was used for normalization (mean±s.d.; n=3, **P<0.01; ***P<0.001). (b) Endogenous protein expression of TCIRG1 in hepatic cell lines was analyzed by western blotting. GAPDH was used as a loading control, and the numbers under the blot indicate the relative expression level of each protein. (c) Clonogenic assays were performed in SNU475 and Huh7 cell lines. Upper panel: representative images of colonies. Lower panel: the data from three randomly selected images shown in the form of a graph (mean±s.d.; n=3, *P<0.05, **P<0.01). (d) SNU475 and Huh7 cell lines were transfected with negative-control siRNA or TCIRG1-specific siRNA. Cell number was determined using trypan blue-based cell counting (mean±s.d., n=3, **P<0.01). (e) SNU475 and Huh7 cell lines were transfected with negative-control siRNA or TCIRG1-specific siRNA. Cell growth was measured by the MTT [3-(4,5-dimethylthiazol-2-yl)-2,5-diphenyltetrazolium bromide] assay. (f) Bromodeoxyuridine (BrdU) incorporation assays were carried out using SNU475 and Huh7 cell lines (mean±s.d.; n=3, *P<0.05, **P<0.01). (g) Fluorescence-activated cell sorting (FACS) analysis was conducted after negative-control siRNA or TCIRG1-specific siRNA transfection. When TCIRG1 was knocked down, G1/S arrest was observed in SNU475 and Huh7 cell lines. The percentage indicates the distribution of cells in the different phases of cell cycle (mean±s.d., n=3, *P<0.05). (h) Negative-control siRNA (NC) or TCIRG1-specific siRNA (siTCIRG1) were transfected into cells. FACS analysis was performed using PI and Annexin V staining. The bar graphs indicate the percentage of annexin V-positive cells (mean±s.d., n=3, *P<0.05). (i) Following transfection, cells were treated with 3-MA (5 mM), and FACS analysis was performed. The bar graph indicates the percentage of Annexin V negative and PI-positive cells (mean±s.d., n=3, ***P<0.001).

