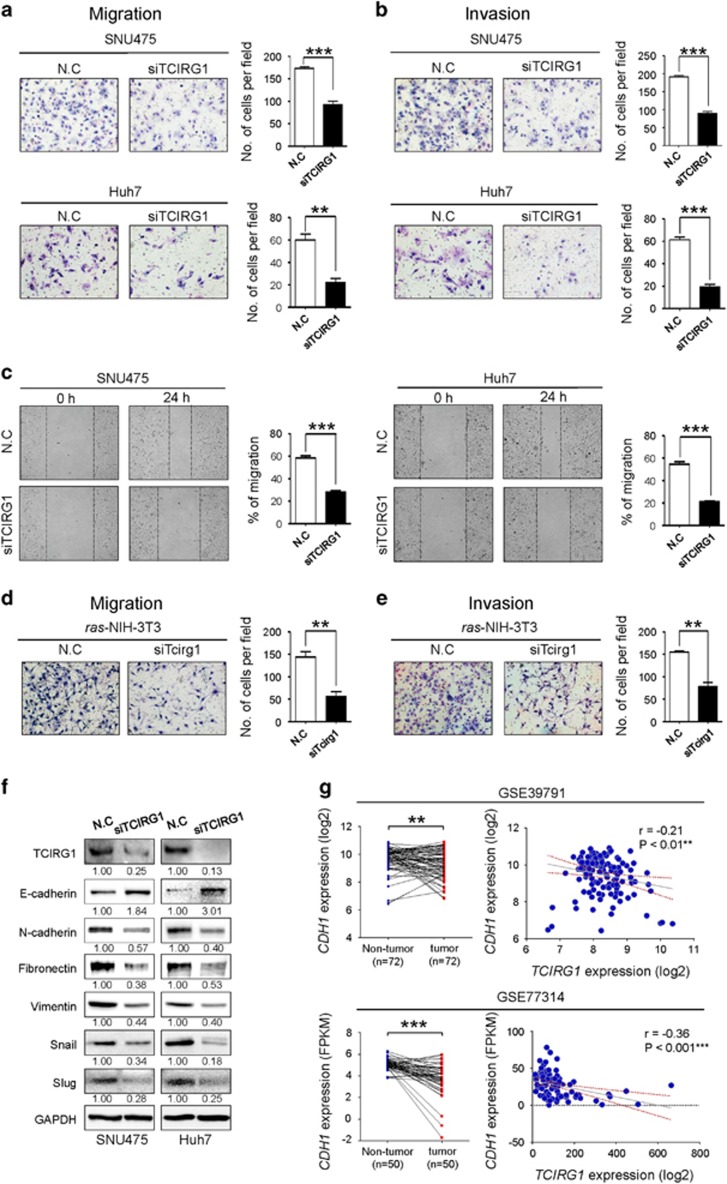
Figure 4.
TCIRG1 knockdown attenuates the metastatic potential of hepatocellular carcinoma (HCC) cells. (a, b) TCIRG1 knockdown inhibited migration (a) and invasion (b) of SNU475 and Huh7 cell lines in vitro. The number of migrated and invaded cells was determined. Three randomly selected fields were captured, and the results were graphically presented (mean±s.d., n=3, **P<0.01, ***P<0.001). Representative images are shown. (c) Wound healing assay. The bar graphs show the ratios of the recovered area (mean±s.d., n=3, ***P<0.001). (d, e) Effect of TCIRG1 knockdown on cell migration and invasion in vitro. TCIRG1 knockdown inhibited migration (d) and invasion (e) of ras-transformed NIH-3T3 mouse fibroblasts. The number of migrated and invaded cells was determined. Three randomly selected fields were captured, and the results were presented in the form of a graph (mean±s.d., n=3, **P<0.01). Representative images. (f) Western blot analysis of epithelial–mesenchymal transition (EMT) markers. The protein level of TCIRG1, E-cadherin, N-cadherin, Fibronectin, Vimentin, Snail and Slug was detected with their specific antibodies. Glyceraldehyde-3-phosphate dehydrogenase (GAPDH) was used as the loading control. The numbers under the blot indicate the relative expression level of each protein. (g) Analysis of the NCBI GEO database. GEO data sets with the accession numbers GSE39791 and GSE77314 were used for expression analysis of TCIRG1 and CDH1. Left panel, CDH1 expression in GSE39791 and GSE77314. Right panel, negative correlation of TCIRG1 and CDH1 expression in GSE39791 (Pearson’s correlation coefficient, r=−0.21, **P<0.01) and in GSE77314 (Pearson’s correlation coefficient, r=−0.36, ***P<0.001).

