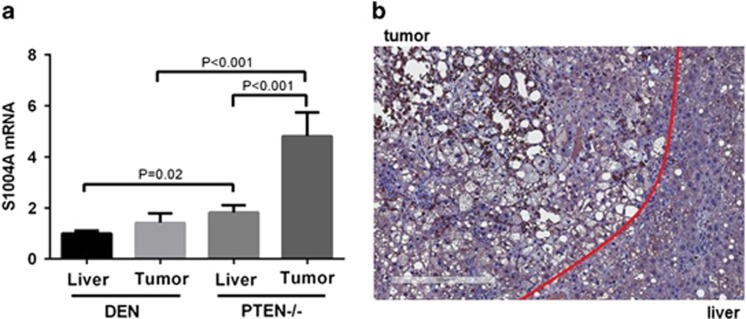
Figure 1.
Expression of S100A4 in mouse models of liver cancer. (a) Expression of S100A4 was measured by quantitative PCR in liver and tumor of DEN model and PTEN−/− model. Data are shown as fold change and standard error of the mean (unpaired student t-test). (b) Immunohistochemistry staining of S100A4 on liver tumor sections from PTEN−/− mice. Scale bar, 300 μm.

