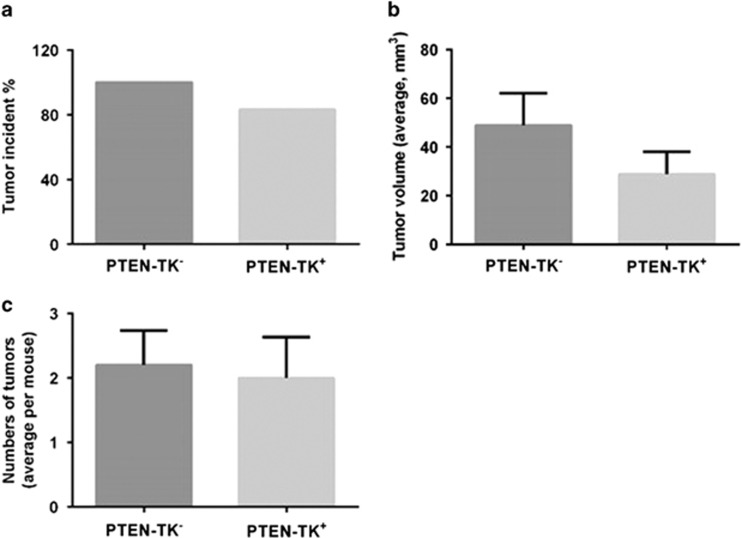
Figure 3.
Effect of S100A4 cell depletion on tumor prevention in vivo. Graphs showing effect of S100A4 depletion on tumor incidence (a), average tumor volume per mouse (b) and average number of tumors per mouse (c). Tumor sizes were measured with calipers in three dimensions at necropsy. Tumor volumes were calculated using the formula tumor volume (mm3)=(L × W2)/2, where L is length and W is width. Graphs were shown as mean±s.e.m.

