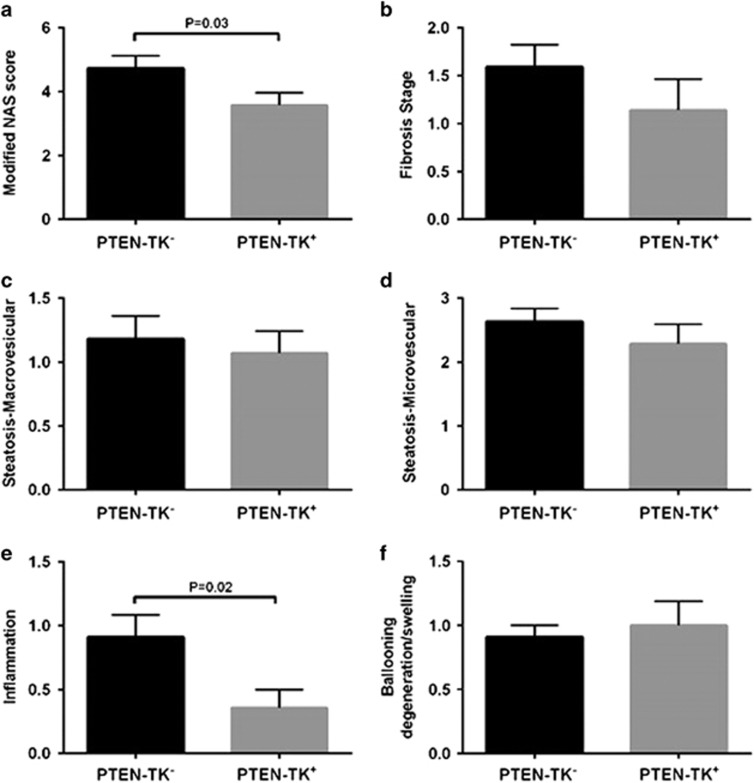
Figure 6.
Effect of S100A4 cell depletion on hepatic histopathology. (a) Modified NAS is the Sum of marcrosteatosis, microsteatosis, inflammation and ballooning scores. (b) Liver fibrosis stage was individually scored as 0 for no fibrosis, 1 for periportal or perivenular fibrosis, 2 for periportal and perivenular, 3 for bridging fibrosis and 4 for cirrhosis. (c, d) Steatosis was individually scored by macrosteatosis (c) and microsteatosis (d) (0 for <5%, 1 for 5–33%, 2 for 33–66%, and 3 for more than 66%). (e) Inflammation was graded by overall assessment of all inflammatory foci (0 for no foci, 1 for <2, 2 for 2–4 foci, and 3 for >4 foci). (f) Ballooning score was 0 for no ballooned cells per field, 1 for few, and 2 for many.

