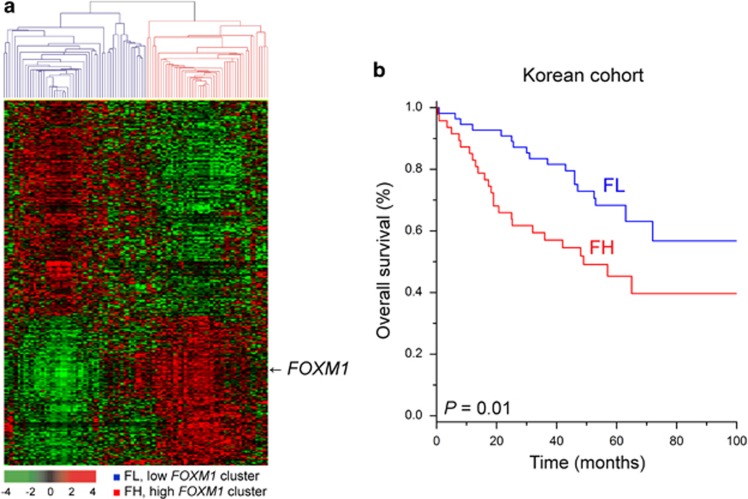
Figure 1.
Gene expression patterns of the co-expressed gene set of FOXM1 and the overall survival of HCC patients in the exploration data set (n=100). (a) Gene expression patterns of FOXM1 and its associated genes. A total of 1,185 genes with expression patterns that highly correlated with FOXM1 were selected for cluster analysis. The patients were divided into two subgroups: FOXM1-high (FH) and FOXM1-low (FL). (b) Kaplan–Meier plot of the overall survival of HCC patients, stratified by the co-expressed gene set of FOXM1. The survival rate of the FH subgroup was significantly worse than that of the FL subgroup (P=0.01 by log-rank test).

