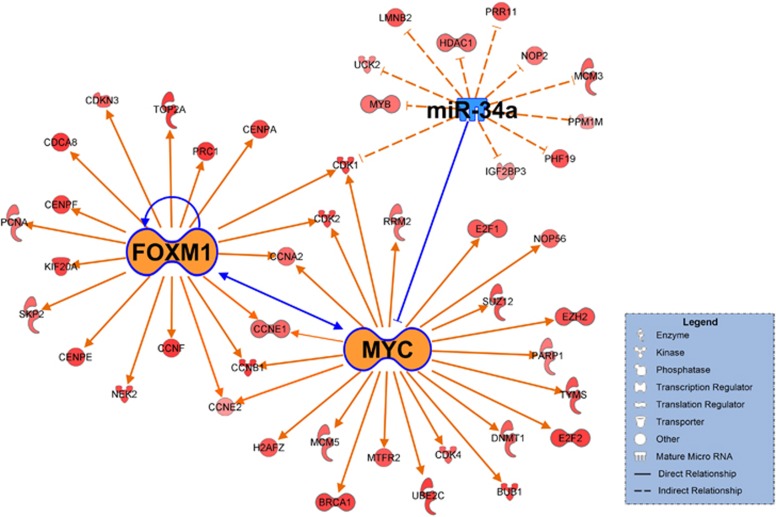
Figure 4.
The putative signaling pathway composed of FOXM1, MYC and miR-34a. Upregulated genes in the FOXM1-high (FH) subgroup are indicated in red. The intensity of color is indicative of the degree of overexpression. Orange- or blue-colored elements indicate predicted activation or inhibition, respectively. Each line and arrow represents the functional and physical interactions between the genes and the direction of regulation reported in the literature. The networks were generated using the Ingenuity Pathways Analysis tool (www.ingenuity.com).

