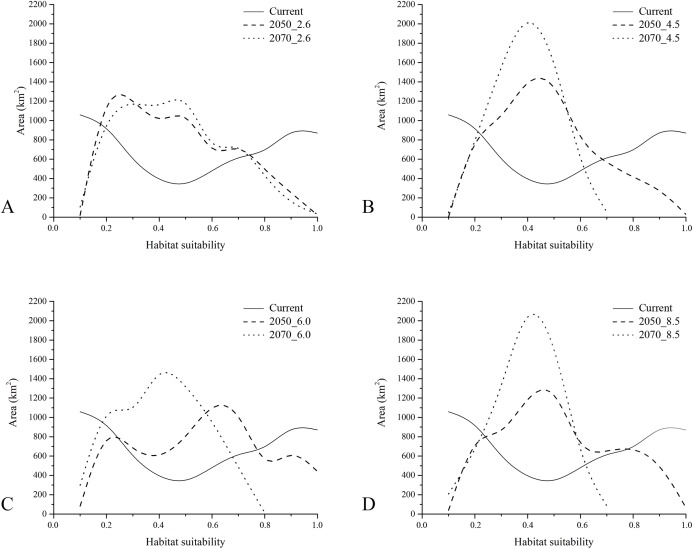
Figure 4. Results of gap analysis performed on Protected Areas and current—future habitat suitability.
Areas (in km2) falling within Protected Areas, as resulting from the gap analysis performed on the raster maps of modelled habitat suitability for current (continuous), 2050 (dashed) and 2070 (dotted) under the four RCP scenarios considered (A = 2.6, B = 4.5, C = 6.0 and D = 8.5).

