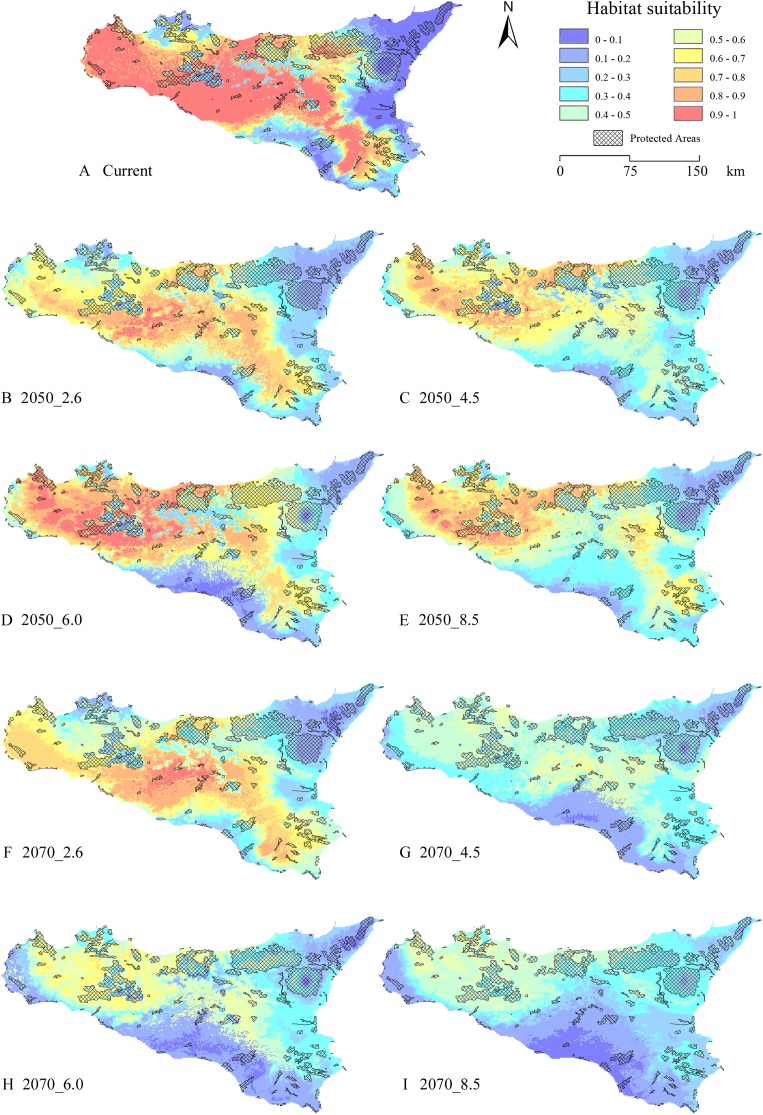
Figure 5. Protected Areas network and current—future habitat suitability maps.
Maps reporting the overlay between modelled habitat suitability (low to high, in blue to red scale), for current ((A) and future scenarios (B) 2050_RCP2.6; (C) 2050_RCP4.5; (D) 2050_RCP6.0; (E) 2050_RCP8.5; (F) 2070_RCP2.6; (G) 2070_RCP4.5; (H) 2070_RCP6.0; (I) 2070_RCP8.5), and the current Protected Areas network (crosshatch pattern).

