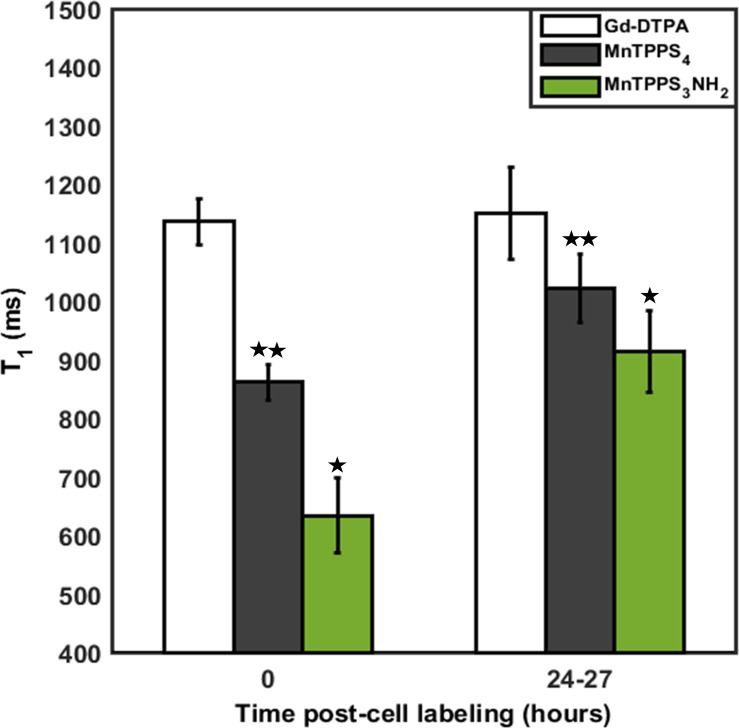
Fig 4. Comparison of CA direct exposure uptake and retention.
Averaged T1 relaxation times of CA-labelled MDA-MB-231 cell pellets at 0 and 24–27 hrs post-cell labelling for the three CAs at 0.2 mM. Shown are mean values ± standard deviation from pixels within the respective ROIs in Figs 2A and 3A. *Indicates significant difference (P < 0.05) from MnTPPS4.** Indicates significant difference (P < 0.05) from Gd-DTPA.

