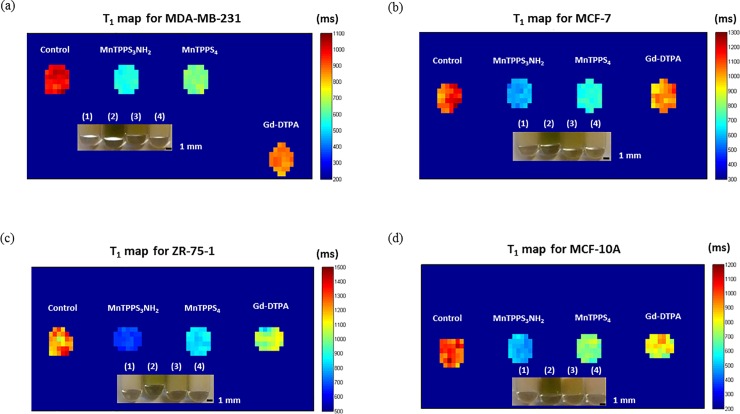
Fig 5. Quantitative maps of T1 relaxation times of breast cell lines.
(a) MDA-MB-231 (b) MCF-7 (c) ZR-75-1 and (d) MCF-10A cell pellets labelled with MnTPPS3NH2, MnTPPS4, and Gd-DTPA at 0.2 mM. Shown also are pictures of the CA-labelled cell pellets: (1) Control; (2) MnTPPS3NH2; (3) MnTPPS4; (4) Gd-DTPA.

