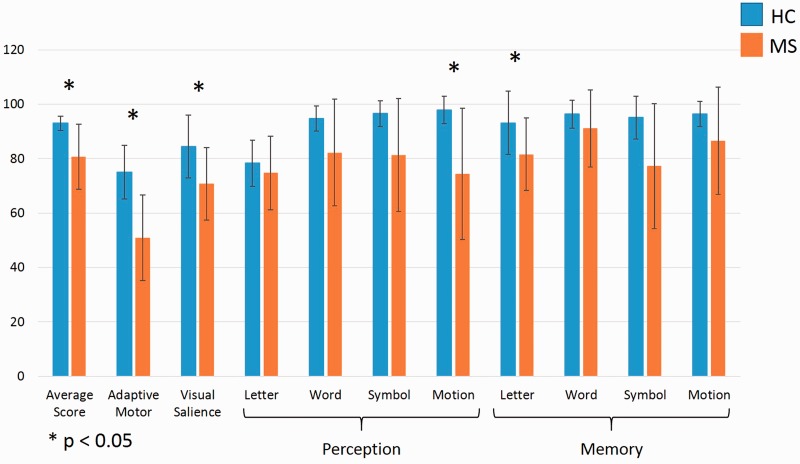
Figure 3.
Cognivue scores. Mean first Cognivue testing scores for both healthy controls (blue) and patients with multiple sclerosis (orange). Perception and memory tasks are identified with labelled brackets. Error bars = SD. Analysis with nonparametric Mann–Whitney tests with correction for multiple comparisons. p < 0.05. HC: Healthy controls; MS: multiple sclerosis.

