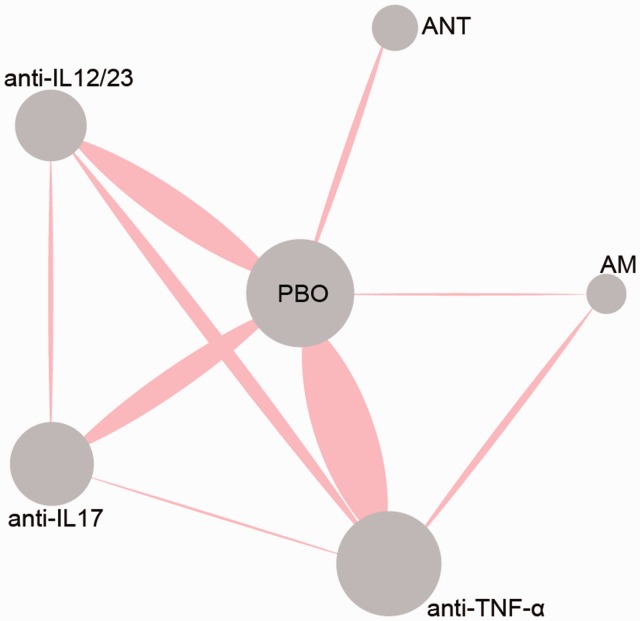
Figure 2.
Network diagram of all included studies. Each node represents a medicine type; the diameters of circles represent the number of people involved, and the widths of lines between two nodes represent the number of study involved in the head-to-head comparison.
AM: anti-metabolites; anti-IL12/23: anti-interleukin-12/23 agents; anti-IL17: anti-interleukin-17 agents; ANT: anti-T-cell agent; anti-TNF-α: anti-tumor necrosis factor-α agent.

