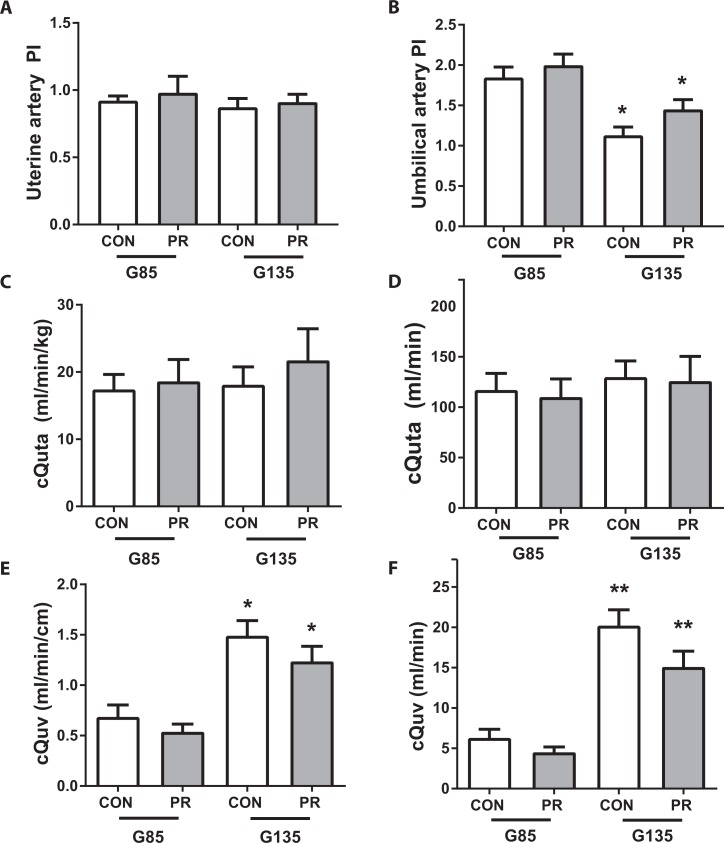
Figure 3.
Uteroplacental blood flow assessed by Doppler ultrasound. A, Uterine artery pulsatility index and (B) umbilical artery pulsatility index; (C) cQuta normalized to maternal body weight and (D) unadjusted cQuta; (E) cQuv expressed as blood flow in mL/min normalized to fetal abdominal circumference and (F) unadjusted cQuv. All measurements taken by Doppler ultrasound in CON and PR animals at G85 (n = 8/group) and G135 (n = 7/group). Data are mean + SEM. *P < .05, **P < .01, G135 versus G85, by 2-way ANOVA with Tukey post hoc test. ANOVA indicates analysis of variance; PR, protein restriction; SEM, standard error of the mean.

