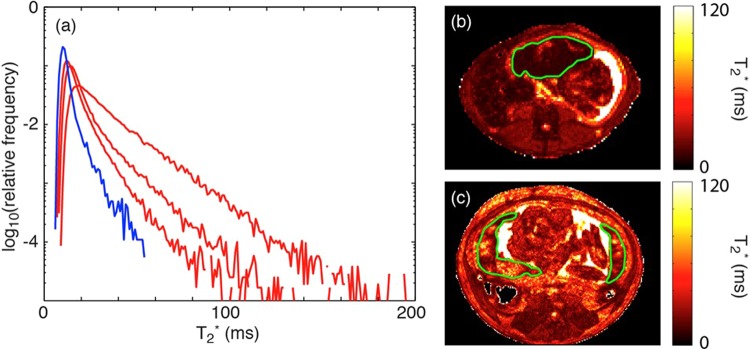
Figure 3.
A, Histogram plot of T2* versus percentage of placental voxels displayed for our case versus control animals at G135. Our case (blue) had a smaller fraction of large T2* values compared to controls (red), demonstrating decreased fetal oxygen availability in the former. B, T2* map of placental insufficiency animal. C, T2* map of a representative control pregnant Rhesus macaque.

