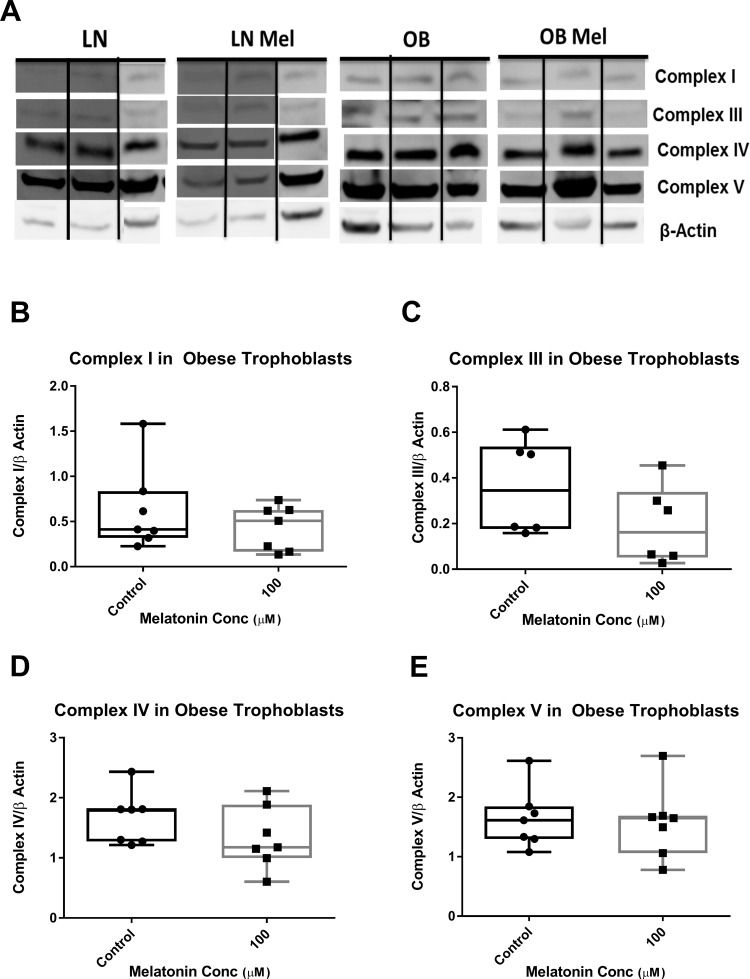
Figure 5.
Expression of mitochondrial electron transport chain complexes: (A) representative Western blots of complexes I, III, IV, and V in trophoblast of lean (n = 4) and obese (n = 7) women treated with and without melatonin 100 µmol/L for 24 hours. Relative protein expression of complex I (B), complex III (C), complex IV (D) or complex V (E) in trophoblasts of obese women. Represented in box and whiskers plot with median, minimum, and maximum values shown due to nonparametric distribution of data.

