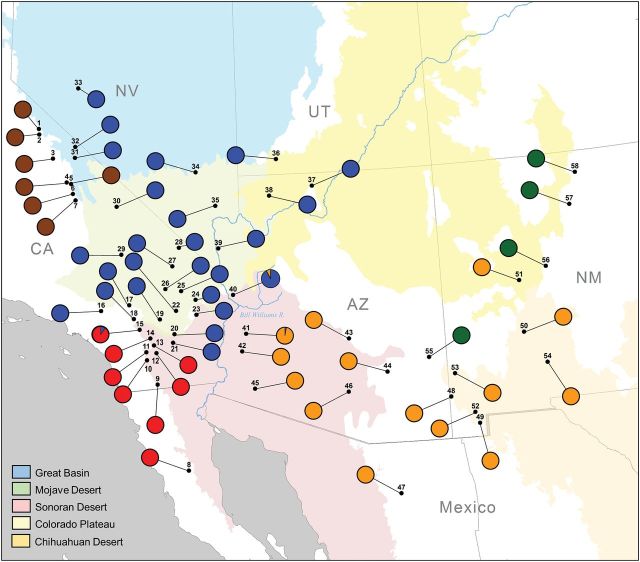
Fig. 4.
Geographic distribution of mtDNA control region haplogroups among sampled herds of Ovis canadensis subspecies, shown as pie diagrams. Locations are numbered as in Figure 1 . For the purpose of illustration, haplotype frequencies for the San Jacinto population (15) include our results and the findings of Boyce et al. (1999) , demonstrating a shared haplotype between the northern Peninsular Ranges and southern Mojave Desert.

