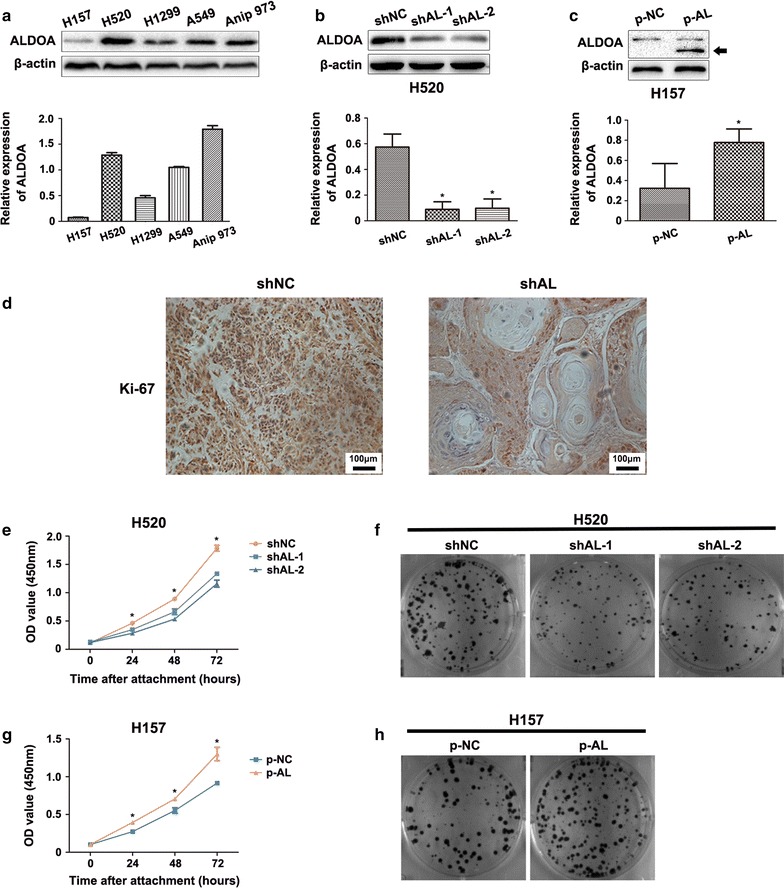
Fig. 1.

Aldolase A (ALDOA) knockdown decreased the proliferation capacity of non-small cell lung cancer (NSCLC). a Comparison of the endogenous ALDOA expression of several NSCLC cell lines. All cell lines except H157 displayed abundant expression of ALDOA. Data are shown as mean ± standard deviation (SD). b H520 cells were stably transfected with pGPU6/GFP/Neo-ALDOA-short hairpin RNA (shAL-1, shAL-2) or pGPU6/GFP/Neo-shNC (shNC, negative control). ALDOA was lower in shAL H520 cells than shNC cells. Data are shown as mean ± SD. *P < 0.05 versus shNC. c H157 was transfected with pcDNA 4.0 to myc his A vector carrying full-length ALDOA cDNA (p-AL) or control sequence (p-NC). Black arrow indicated exogenous ALDOA. Data are shown as mean ± SD. *P < 0.05 versus shNC. d Immunohistochemistry assays for Ki-67 in tumor xenografts. Ki-67 expression was suppressed in shAL H520 cells compared with that in shNC cells. e Cell proliferation was assessed by the Cell Counting Kit-8 assay after cells had been attached for 0, 24, 48 and 72 h. The results showed that cell proliferation was inhibited in the shAL group compared with that in the shNC group. Data are shown as mean ± SD. *P < 0.05 versus shNC. f Representative images of colony formation assay of the above cells. Cells were fixed and stained with crystal violet 10 days after conventional culture. Both the volume and number of the colonies were lower in the shAL than shNC group. g Cell proliferation was promoted in the p-AL group comprared with that in the p-NC group. Data are shown as mean ± SD. *P < 0.05 versus shNC. h Representative images of colony formation assay showed that both the volume and number of the colonies were higher in the p-AL than p-NC group
