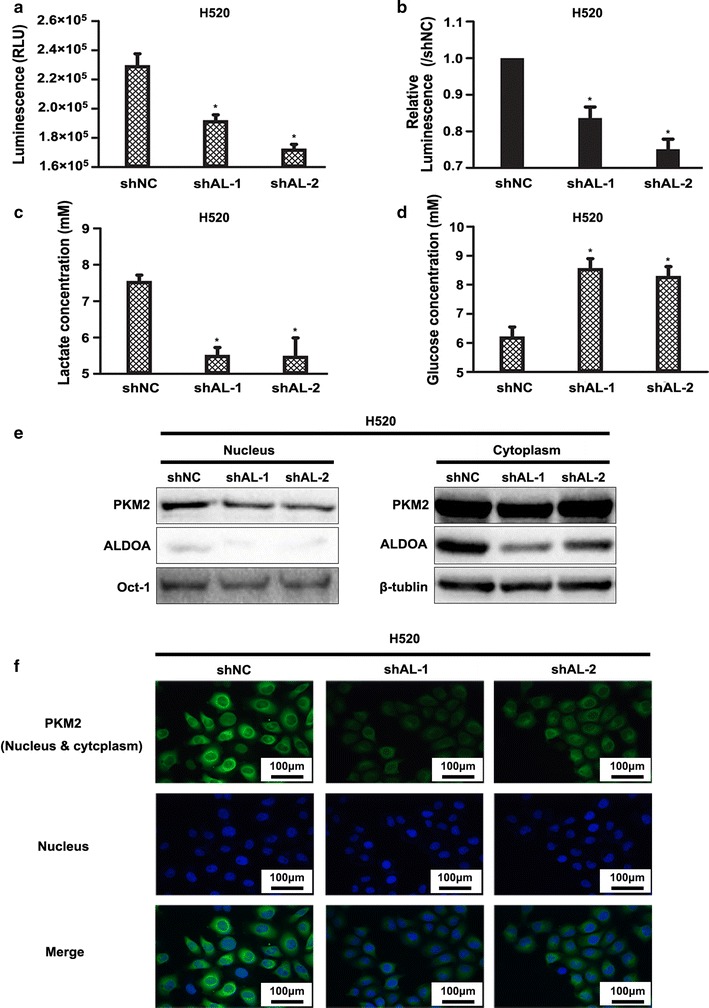
Fig. 7.

ALDOA-knockdown suppressed aerobic glycolysis of H520 cells. a Intracellular adenosine triphosphate (ATP) levels. The Cell Titer-Glo Luminescent Assay Kit was used to test the intracellular ATP concentration in the indicated cell lines. The luminescence signal was measured to reflect the ATP concentration. b Luminescence signal of ATP compared with control group (shNC). The results indicated that the intracellular ATP concentration was lower in the shAL than shNC group. *P < 0.05 versus shNC. c Extracellular lactate concentration and d glucose concentration were measured using lactate and glucose colorimetric assay kits, respectively. Absorbance at 450 nm was measured and then transformed according to the manufacturer to reflect the lactate or glucose concentration of the supernatant. The results suggested that the extracellular lactate concentration was lower and that the extracellular glucose concentration was higher in the shAL than shNC group. *P < 0.05 versus shNC. e The pyruvate kinase M2 (PKM2) distribution was determined by western blotting. Nuclear and cytoplasmic proteins were separately extracted. Oct-1 or β-tubulin was used as a loading control of the nucleus and cytoplasm, respectively. f Immunofluorescence assay of PKM2. PKM2 protein was labeled with fluorescein isothiocyanate-conjugated antibody (green). The nucleus was stained with 4′,6-diamidino-2-phenylindole (blue). The results in e and f suggested that PKM2 was predominantly decreased in the nucleus in ALDOA-knockdown H520 cells compared with negative control cells
