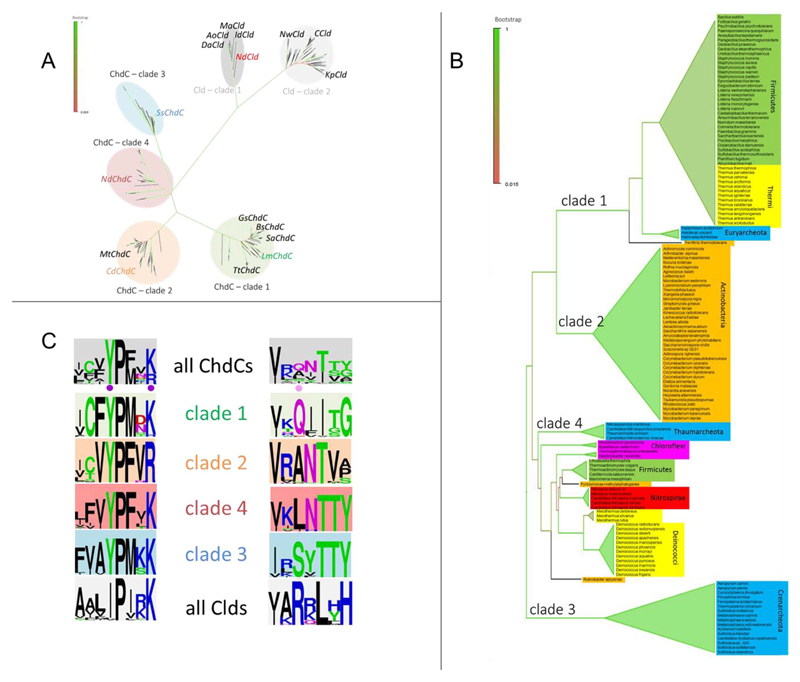
Fig. 1. Phylogeny of ChdCs and Clds.
(A) Phylogenetic overview of sequences of the CDE structural superfamily. The Maximum-Likelihood phylogenetic tree is represented in the radial tree layout, representatives that were studied on a protein level are written out in black; targets of this study are colored. (B) Rectangular tree layout of the ML-tree of ChdC sequences analyzed within this study. (C) Sequence alignments and fingerprints represented as WebLogos of all sequences present in the phylogenetic analysis. Positions of the catalytic residues for ChdCs are indicated with a purple point and the position of the catalytic Cld residue with a pink dot. (For interpretation of the references to color in this figure legend, the reader is referred to the Web version of this article.)

