Figure 2.

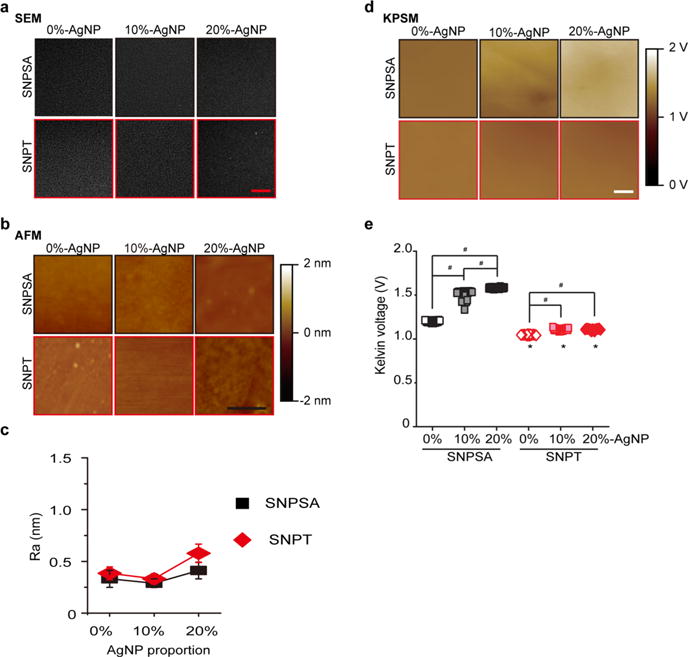
SNPSA and SNPT surface morphologies and surface potentials. (a) SEM demonstrated an even, smooth AgNP/PLGA coating on SNPSA and SNPT with increasing AgNP proportions (0, 10, and 20%) in the coating layer. Scale bar: 20 μm. (b) AFM images confirmed that a homogeneous AgNP/PLGA matrix layer was generated on both the 316L-SA and titanium materials. Scale bar: 1 μm. (c) Measurements of surface roughness (Ra) show that there were no statistical differences between SNPSA and SNPT materials with the same AgNP proportions (N = 3). (d) KPFM documented the SPs of SNPSA and SNPT. Scale bar: 5 μm. (e) SP was quantified by analyzing a variety of different locations (N = 29). SNPSA had an increased SP, while no significant change in SNPT’s SP was detected, even with an increasing AgNP proportion. Mann–Whitney analyses were used to detect statistical differences. #(p < 0.05), significant difference resulting from different AgNP proportions; *(p < 0.05), significant difference between SNPT and SNPSA with the same AgNP proportions.
