Figure 3.

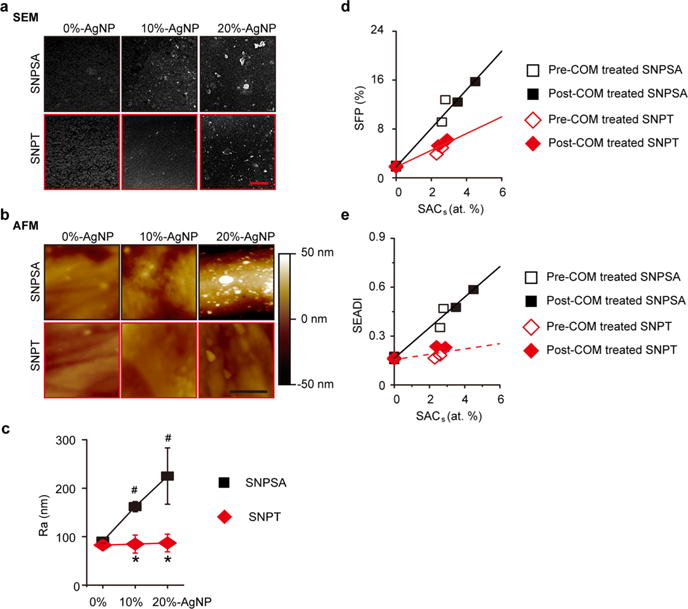
Surface morphologies and properties of SNPSA and SNPT after COM treatment. (a,b) 6 days after COM treatment, SEM and AFM images showed that the SNPSA surfaces presented markedly heterogeneous morphologies with increasing AgNP proportions (0, 10, and 20%), while the SNPT surfaces did not show a significant change after COM treatment. Scale bar in a: 20 μm. Scale bar in b: 1 μm. (c) Surface roughness (Ra) measurement showed a significant difference in the surface morphology between SNPSA and SNPT at various AgNP proportions (0, 10, and 20%) after COM treatment. (d) Linear relationship between SFP and SACs was observed in both SNPSA and SNPT at various AgNP proportions (0, 10, and 20%) (SNPSA/SFP = 3.47 × SACs + 1.66, Pearson’s correlation coefficient = 0.964; SNPT/SFP = 1.11 × SACs + 1.70, Pearson’s correlation coefficient = 0.974). (e) Linear relationship between SEADI and SACs was observed in SNPSA (0, 10, and 20%) (SEADI = 0.0984 × SACs + 0.148, Pearson’s correlation coefficient = 0.955), but not between the SEADI and SACs of SNPT (0, 10, and 20%) (SEADI = 0.0063 × SACs + 0.156, Pearson’s correlation coefficient = 0.743). SNPSA’s higher slope suggests that the Ag content on the surface had a significant effect on SNPSA’s surface property because of the galvanic redox system in the coating layer. One-way ANOVA and two sample t-tests were used to detect statistical differences (N = 3). #(p < 0.05), significant difference in comparison with 0% SNPSA; *(p < 0.05), significant difference between SNPT and SNPSA with the same AgNP proportions.
