Figure 5.

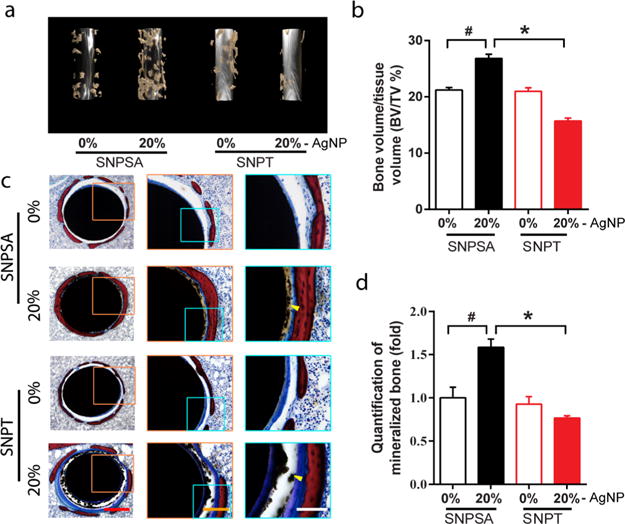
In vivo osteogenic effects of SNPSA and SNPT in a rat FIR model. (a) 3D μCT reconstruction images of new bone formation in rat FIR cavities around 0% and 20% SNPSA and SNPT 8 weeks after implantation. More bone formed around 20% SNPSA than other tested materials. (b) Ratios of BV to TV (BV/TV) between SNPSA and SNPT were quantified. 20% SNPSA with the galvanic redox reaction showed significantly higher BV/TV when compared to the other groups. (c) Histological cross-section images of SNPSA and SNPT implants stained by Sanderson’s rapid bone staining showed more mineralized bone (red staining) around the 20% SNPSA implants. More fibrotic soft tissue (blue staining) and cartilage-like tissue (purple staining) were observed around the 20% SNPT implants. Yellow arrows indicate the AgNP aggregation (black dots). Scale bar: 400 μm (red), 200 μm (orange), 100 μm (white). (d) Quantification analysis of the SNPSA and SNPT implant histological images (N = 5). Kruskal–Wallis and Mann–Whitney analyses were used to detect statistical differences. #(p < 0.05), significant difference in comparison with 0% SNPSA; *(p < 0.05), significant difference between SNPT and SNPSA at the same AgNP proportions.
