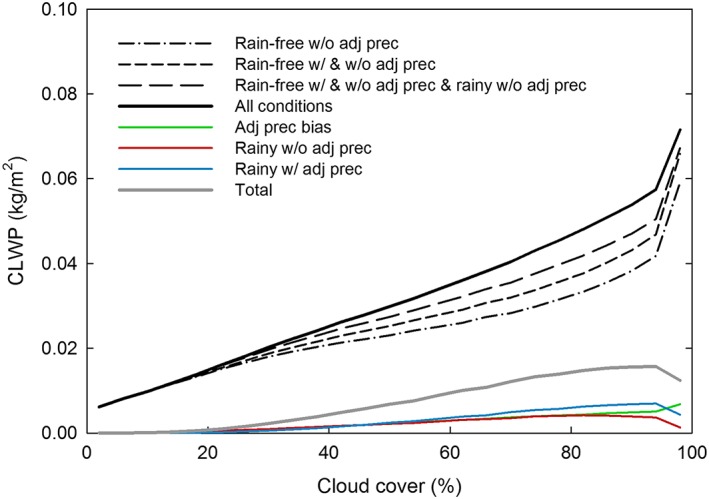
Figure 12.

Effects of precipitation classification types on Advanced Microwave Scanning Radiometer‐Earth Observing System cloud liquid water path observations (black curves) and contributions from each class (colored curves) as a function of cloud cover for the 2008 collocated multisensor data set.
