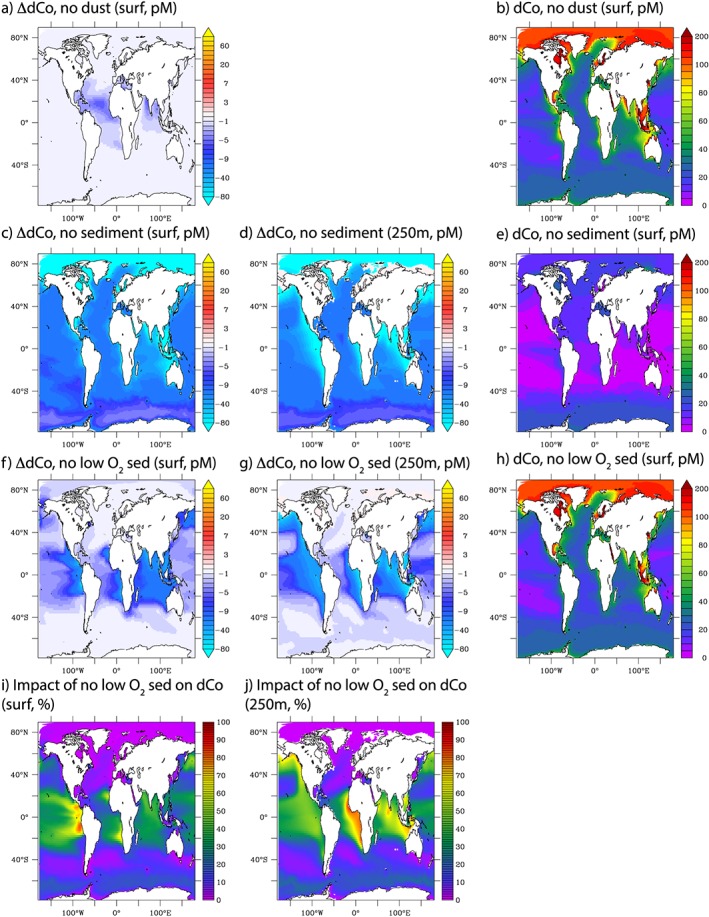
Figure 6.

Absolute change in dCo (pM) at the surface (0–50 m) and at 250 m for no dust (a), no sediment supply (c and d), no sediment supply at low bottom water O2 (f and g), and the percentage of the total change due to sediment supply caused by low bottom water O2 sediment supply (i and j). (b, e, and h) The annually averaged surface dCo from the no dust, no sediment, and no sediment supply at low bottom water O2, respectively—please compare to Figure 2a.
