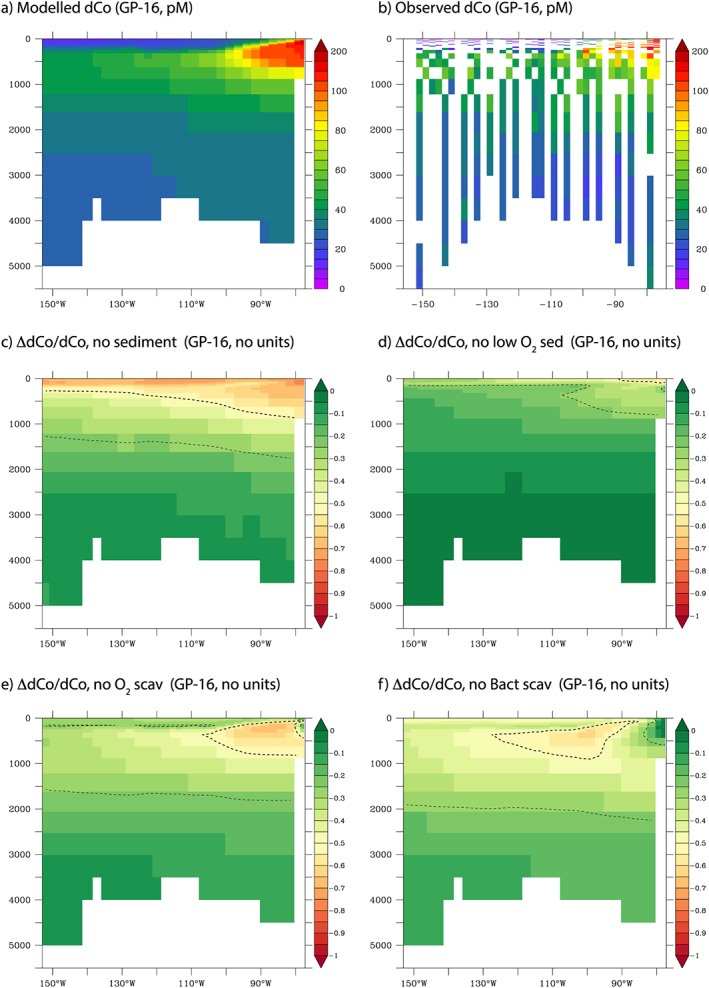
Figure 8.

How different processes shape the Co plume observed on GP‐16. Top row shows (a) model and (b) data dCo (pM), while middle and bottom rows show the proportional change in dCo when there is (c) no sediment supply, (d) no enhanced sediment flux at low O2, (e) no reduction in scavenging at low O2, and (f) no reduction in scavenging at low rates of bacterial activity. Thick and thin contours highlight where a given process affects 50% and 25% of the magnitude of the dCo plume, respectively.
