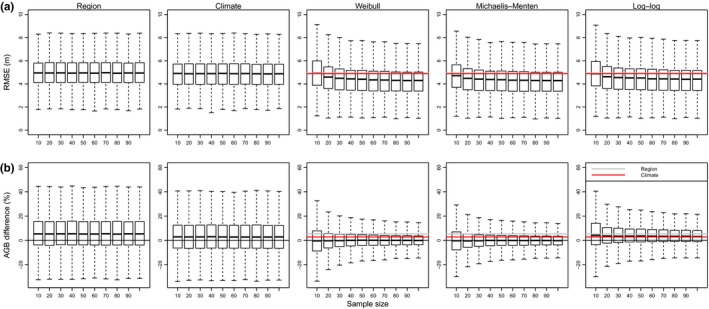
Figure 1.

Relationship between the number of height measurements used to train tropical tree height–diameter models and (a) height prediction error (the square‐root of mean squared error, RMSE) when tested on an independent sample of 50 trees in the same permanent sampling plot and (b) difference in the above‐ground biomass (AGB) of these 50 trees when estimated using predicted height and when estimated using observed height. The performances of regional (Feldpausch et al., 2012) and climate‐based (Chave et al., 2014) height–diameter models tested on the same testing data are shown for comparison with locally derived Weibull, Michaelis–Menten and log–log models. Boxplots show variation in values averaged across iterations for each sample size in each plot. For clarity, outliers (points >1.5 × box length away from the upper or lower quartile) are not plotted. The grey line in each plot shows the median RMSE value for regional height–diameter models pooled across all plots and iterations, whereas the red line shows the median RMSE value for the climate‐based height–diameter model—in some cases only one line is visible due to over‐plotting
