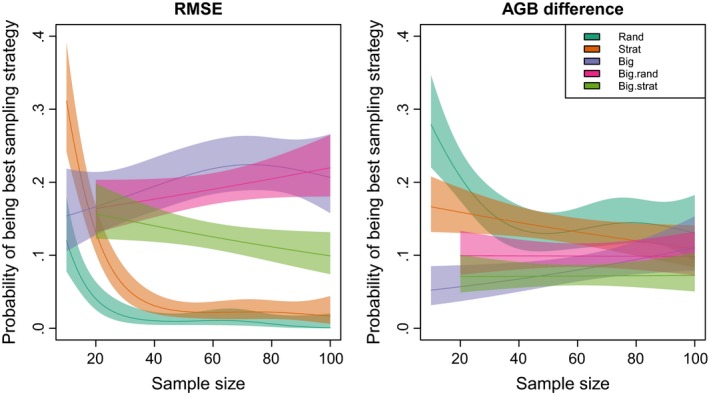
Figure 3.

Probability of different sampling strategies resulting in the best performing tropical tree local height–diameter model, where model performance was assessed as (1) height root‐mean squared error (RMSE) and (2) the difference between estimated stand‐level above‐ground biomass (AGB) using modelled heights and stand‐level above‐ground biomass (AGB) estimated using observed heights. n trees were sampled either randomly, stratified according to size class (Strat), the largest n trees were sampled (Big), the 10 largest trees where sampled with the remaining trees randomly sampled or stratified by size class (BigStrat). For each plot. The probability of a sampling strategy resulting in the best performing model was modelled as a function of sample size using generalised additive models. Fitted relationships and 95% confidence intervals are shown
