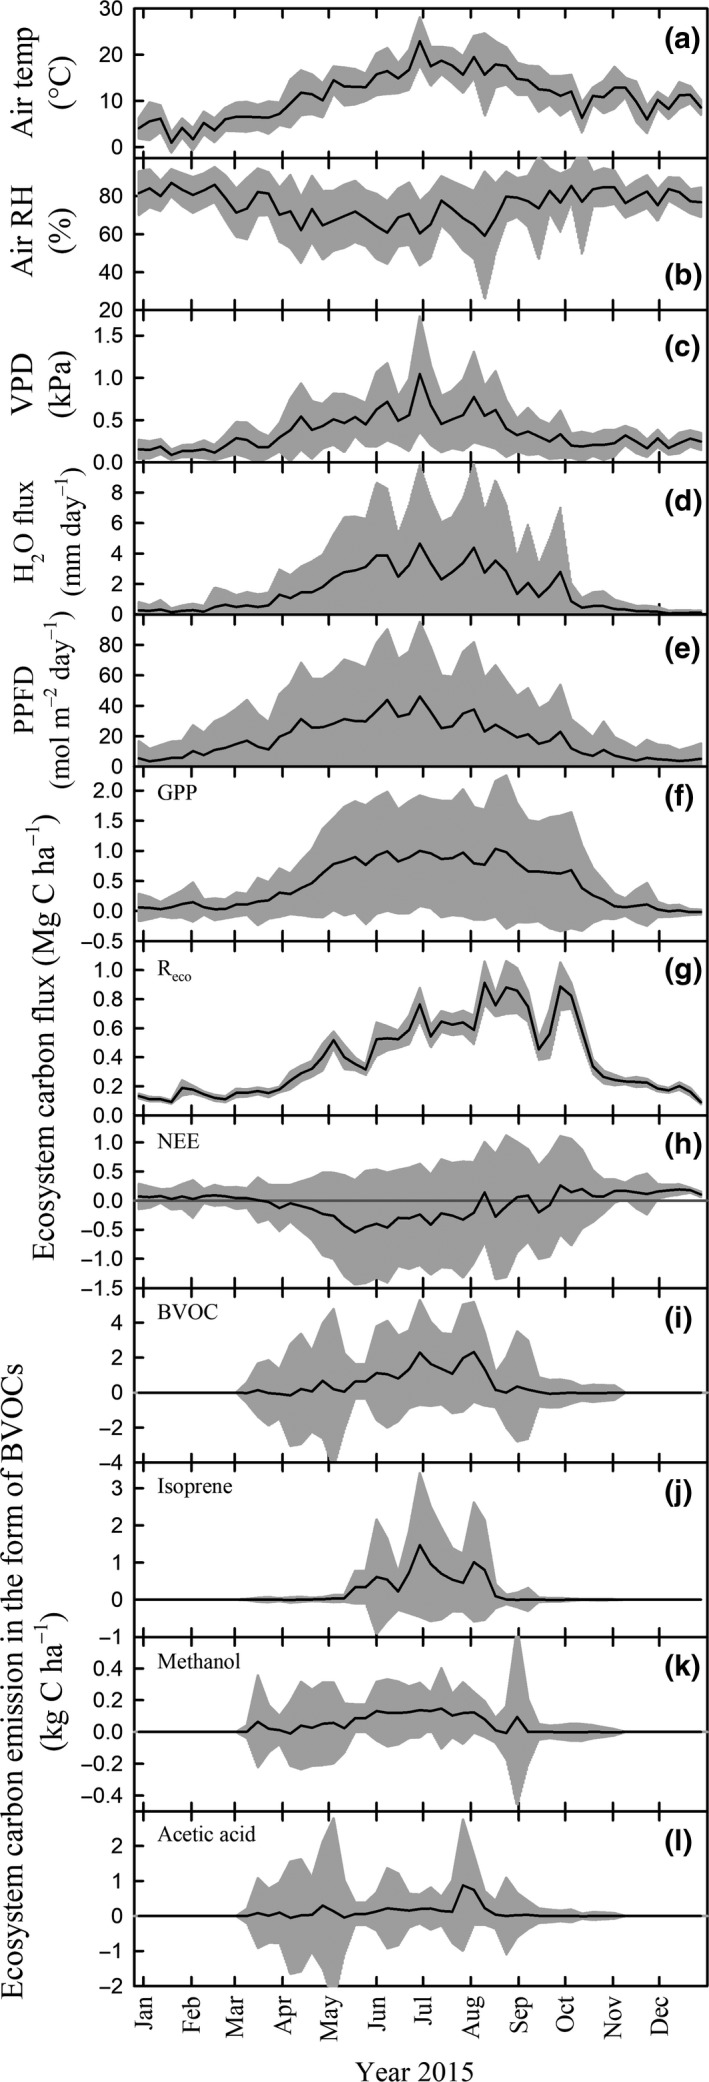
Figure 2.

Weekly (a–c, e) meteorological data, (d) water evapotranspiration and (f–h) ecosystem carbon fluxes as CO 2 and (i–l) as biogenic volatile organic compounds (BVOCs) during the year 2015. Values of the black line are the weekly average of 30‐min data and the gray area represents their standard deviation. Air temp, air temperature; RH, relative humidity; VPD, vapor pressure deficit; PPFD, photosynthetic photon flux density; Reco, ecosystem respiration; NEE, net ecosystem exchange; and GPP, gross primary production.
