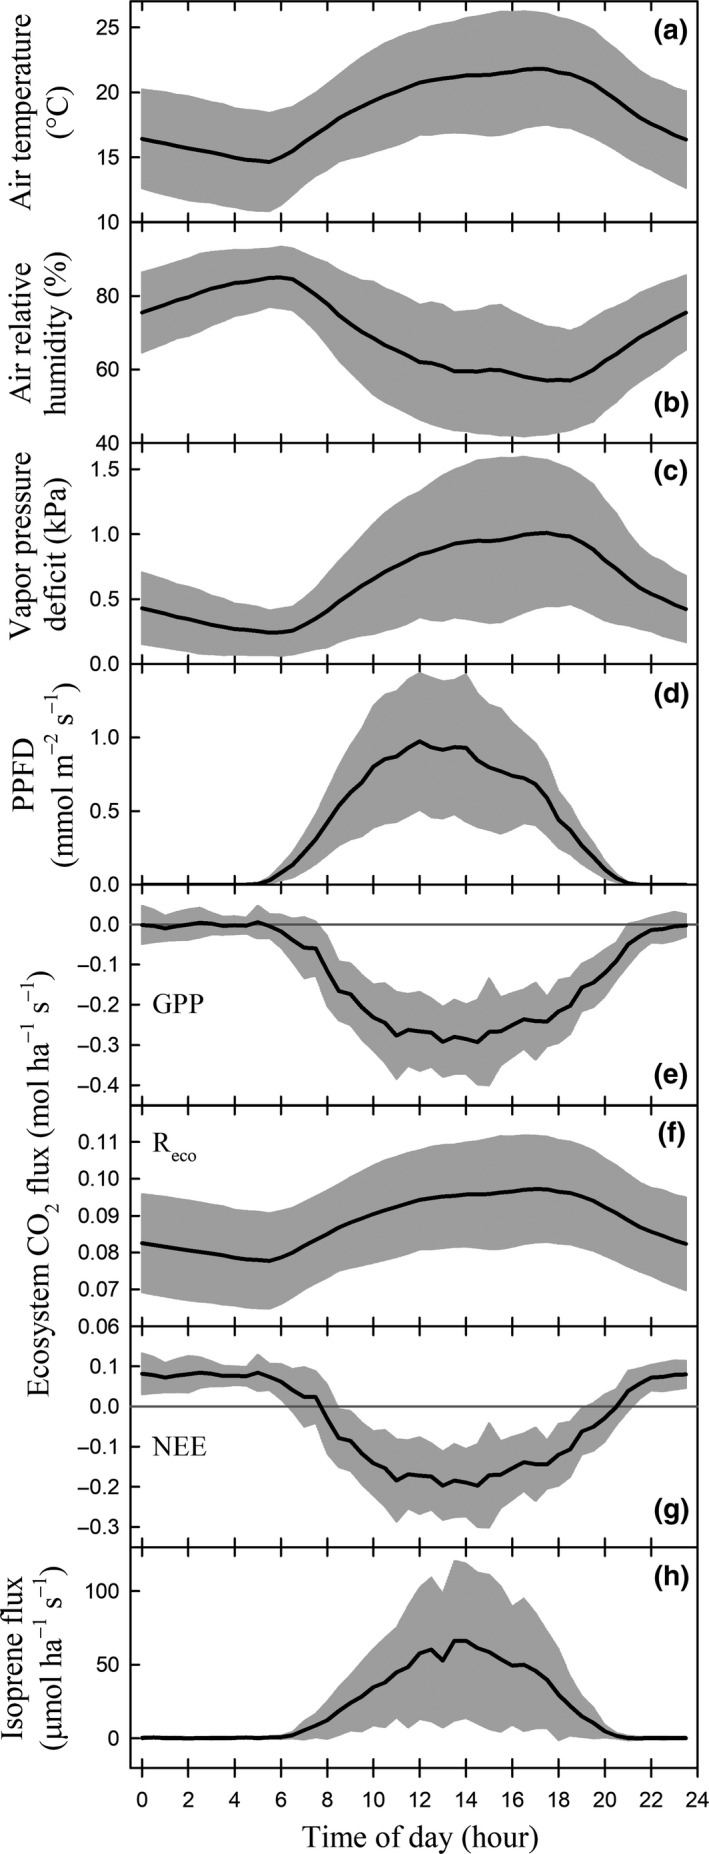
Figure 3.

Diurnal pattern of (a–d) environmental parameters and molar fluxes of (e–g) CO 2 and (h) isoprene in July 2015. The black lines represent the monthly averaged half‐hourly values and the shaded area covers the standard deviation among the 31 days at each half‐hour time window. Time is reported as local time = GMT+1, no summertime daylight saving time correction. In (c), vapor pressure deficit is a function of air temperature and air relative humidity. In (d), PPFD, photosynthetic photon flux density. In (e–g), GPP, gross primary production; Reco, ecosystem respiration; and NEE, net ecosystem exchange.
