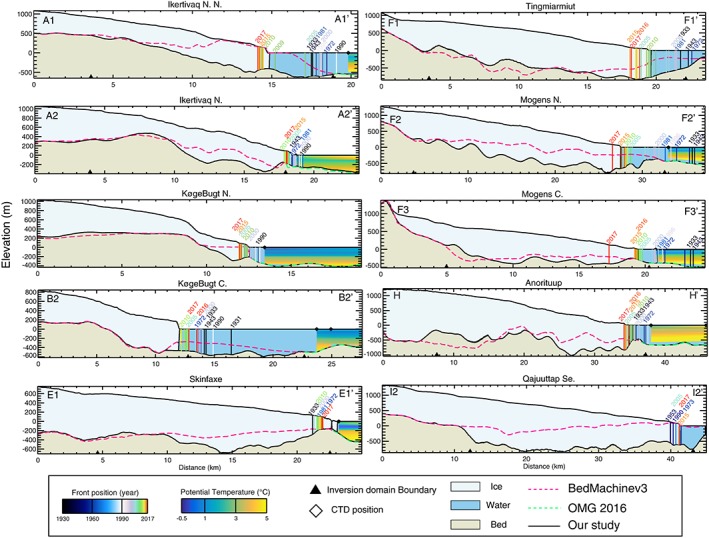
Figure 3.

GIMP v2.1 (from BM3) surface elevation along profiles in Figure 2 with bed elevation from BM3 (dashed red), OMG bathymetry (dashed green), and bed elevation from this study (solid black). Ocean is blue, ice is light blue, and bed is light brown. Ice front positions are color coded from blue to red and labeled by year. Ocean Melting Greenland (OMG) temperature from conductivity‐temperature‐depth (CTD) casts in 2016 are color coded from blue (cold) to yellow (warm), with CTD position as a diamond. Limits of the gravity inversion are black triangles.
