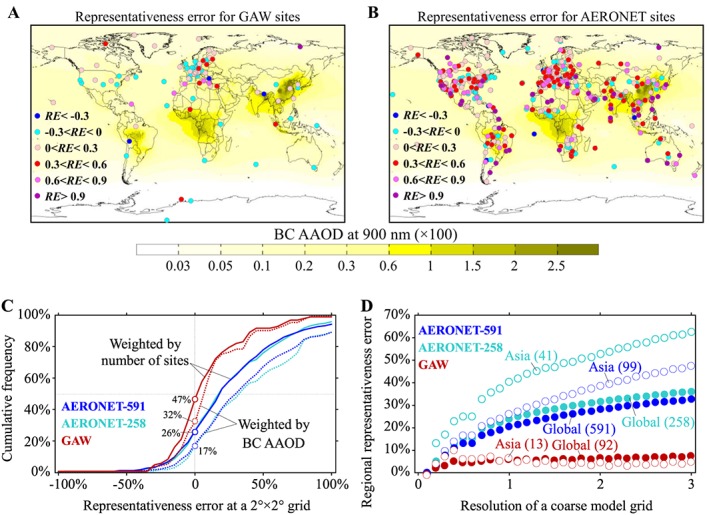
Figure 1.

Evaluation of the representativeness error for the AErosol RObotic NETwork (AERONET) and Global Atmosphere Watch (GAW) networks. (A and B) Representativeness error computed when using modeled black carbon (BC) aerosol absorption optical depth (AAOD) from a 0.1° × 0.1° grid as representative of a 2° × 2° coarse model‐grid for each (a) GAW and (b) AERONET site. The 0.1° × 0.1° BC AAOD field is shown by the color bar. (c) Cumulative frequency distributions of the representativeness error (RE) using BC AAOD over a 2° × 2° grid box relative to a 0.1° × 0.1° resolution positioned at GAW (red) and AERONET (blue or cyan) sites. The distributions are weighted by the number of sites (solid lines) or modeled BC AAOD (dash lines). A vertical dotted line at 0 and a horizontal dotted line at 50% are plotted to show the asymmetry. The labels next to circles denote the percentages of negative RE. (d) Dependence of the regional representativeness error on the grid resolution relative to 0.1° × 0.1° grid boxes for all sites (solid circles) and Asian sites (open circles) of the GAW (red) and AERONET (blue or cyan) networks. The number of sites is listed in parentheses. (C and D) For AERONET, we compare the result by using 591 sites (blue) covering data up to 2013 by Wang et al. (2016) or 258 sites (cyan) covering data up to 2008 by Kinne et al. (2013).
