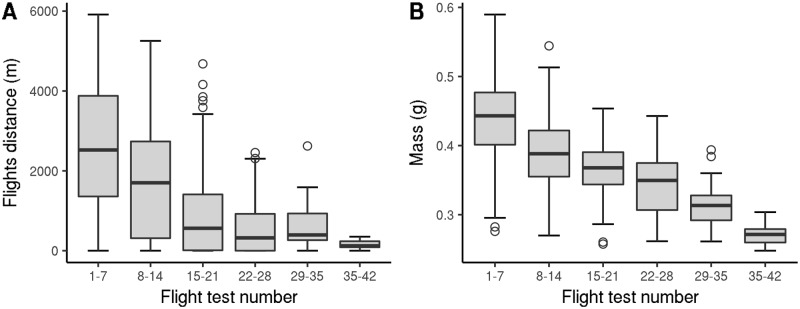
Fig 5. Changes in V. velutina worker flight-related characteristics over the course of successive flight tests (2012 experiment).
A: Flight distance per hour. B: Mass at the beginning of the flight test. ANOVA p-value for flight test number = 3.3 × 10⁻⁷ and 1.8 × 10⁻⁵ for A and B, respectively; workers that performed less than 14 flight tests were excluded to avoid singularities in ANOVA. As no workers captured while foraging were tested more than 27 times, the data from flight test number 29 was obtained from workers sampled from nests.

