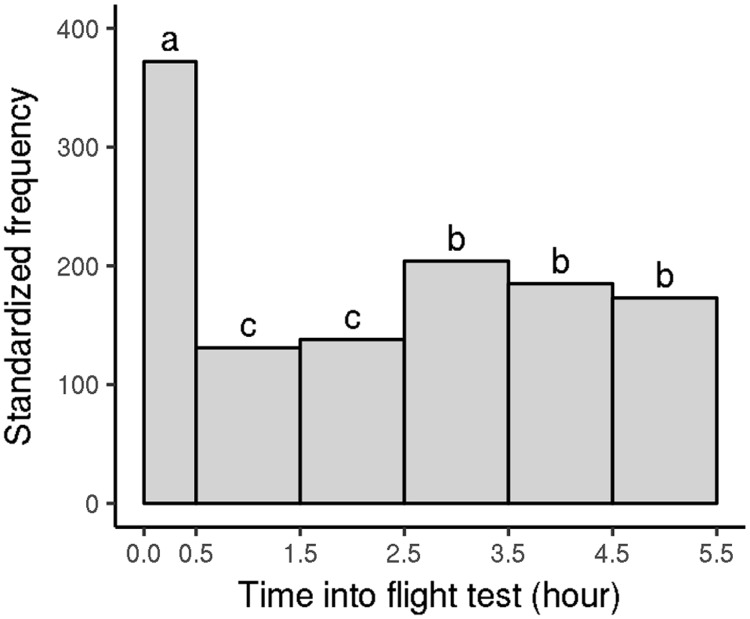
Fig 9. Distribution of flight phases performed by V. velutina workers according to the time into the flight test (2012 experiment).
Only the first five flight tests were considered for each worker. Flight phases were distributed according to their time of beginning. Because some flight tests finished after around 5.5 h, when others ran longer, any flight phases beginning after 5.5 h were excluded to avoid biasing the overall results. Frequencies were standardized to reflect the number of phases per hour of flight test. Differences in letters indicate significant differences in frequencies; global χ2: p-value < 2.10−16; χ2 between late morning (0.5–2.5 h) and afternoon (2.5–5.5 h): p-value = 0.0015).

