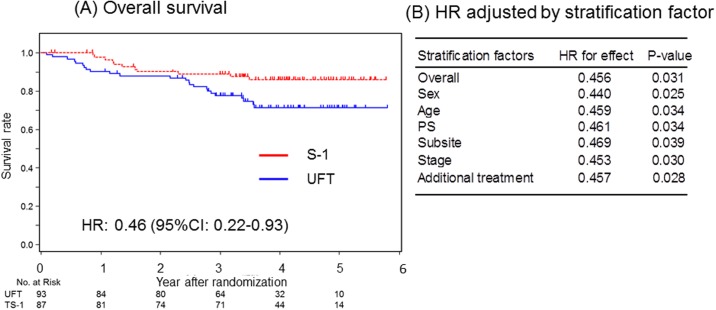
Fig 3. Overall survival in the CRT group.
(A) OS derived from Kaplan–Meier curves. (B) HR and corresponding CI were calculated using Cox proportional hazard model. P values were calculated based on stratified log-rank test. Abbreviations: CI, confidence interval. HR, hazard ratio. OS, overall survival.

