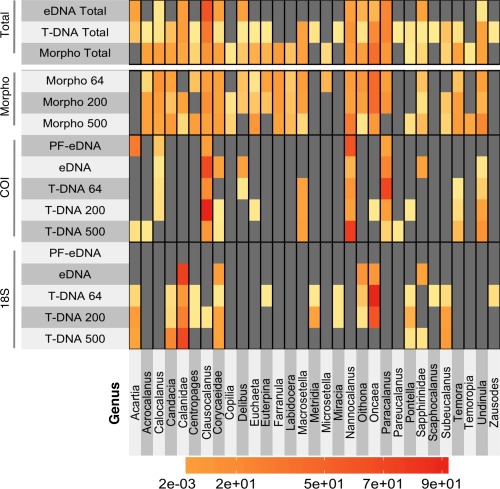
Figure 5.

Heatmap of all copepod data compared between the two loci, 18S rRNA and COI, and morphological assessment. The totals at the top represent both genetic loci for PF‐eDNA and eDNA combined, T‐DNA of all three size fractions, and morphology of all three size fractions. The numbers on the left side refer to the mesh size used in the net tows. The color scale indicates relative abundance between the different samples.
